How Did AI Models Perform for Hurricane Imelda?
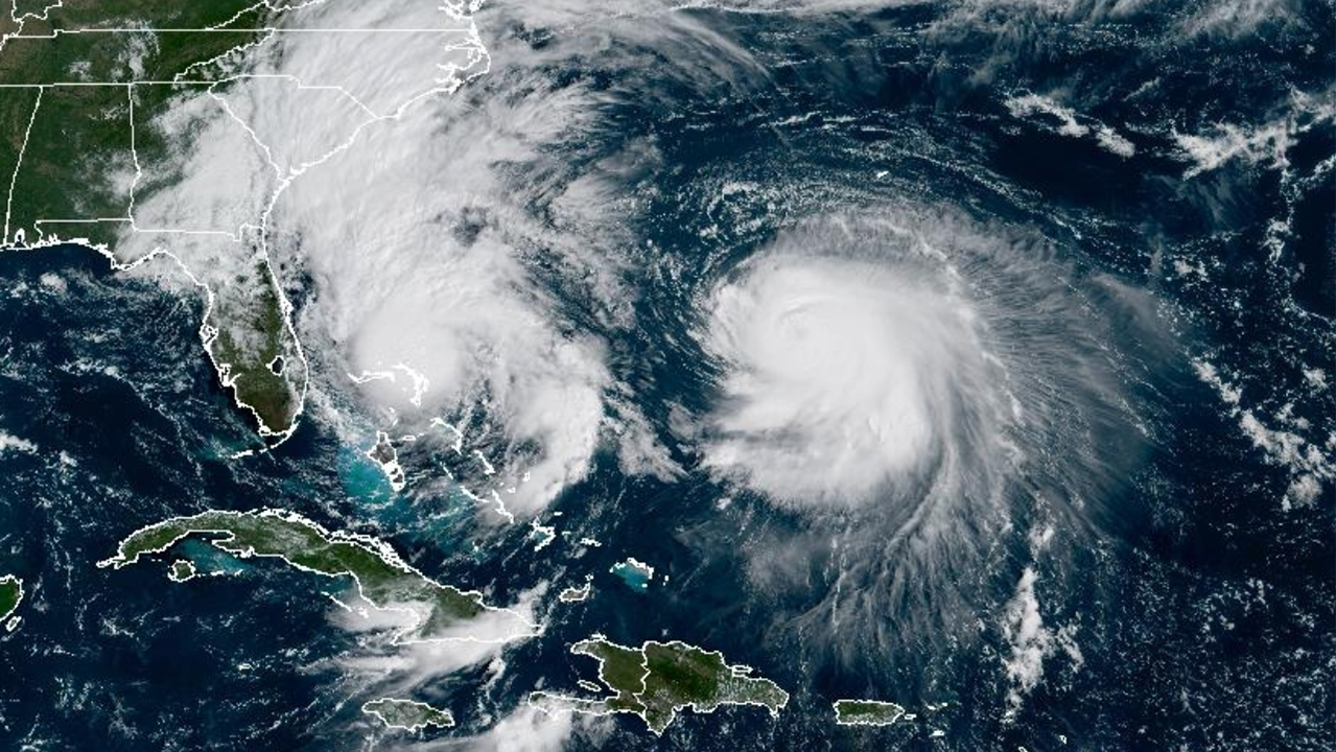
This is our second detailed look this week at recent performance of AI forecast models for a high-profile tropical cyclone. Here we will explore the performance for Hurricane Imelda, which was unique due to the “Fujiwhara” interaction with Humberto to its east, and the potential for threatening the US Coastline (which thankfully did not materialize, though it did impact Bermuda).
As a reminder, these are the AI models examined (in addition to HAFS-A/HFSA and GFS/AVNO):
AIEN: AIFS Ensemble Control
AISN: AIFS Deterministic
PANG: Pangu Weather
AURO: Aurora
GRPC: GraphCast
GDMN: Google’s Deepmind FNV3 Ensemble Mean
Track
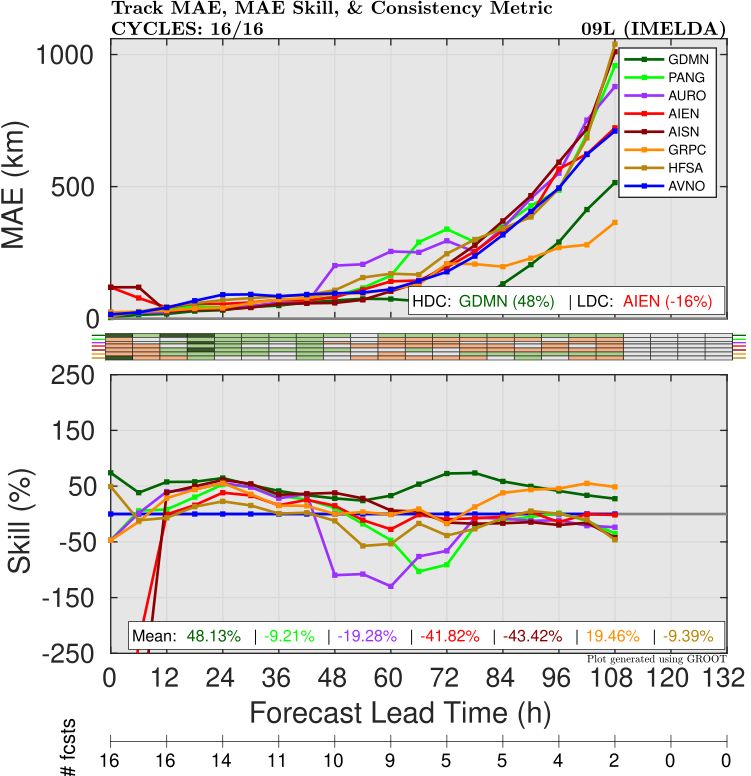
The overall forecast performance for the AI models was fairly good, similar to other cases we have looked at so far this year. Most models showed skill comparable to or better than that of the operational GFS (Figure 1), although Aurora and PanguWeather were not as good in the Day 2-3 forecast window. The best performers were Google Deepmind/FNV3 and GraphCast, which both had significantly lower errors than the rest of the models.
We took a deeper look at the errors by splitting them up into along-track (fast/slow) vs. across-track (left vs. right of observed) errors. Both of these would be affected by the complex interaction between Humberto and Imelda, which was discussed in an earlier blog here:
https://www.brightband.com/blog/a-tricky-setup-atlantic-model-forecast-discussion-9-24-2025
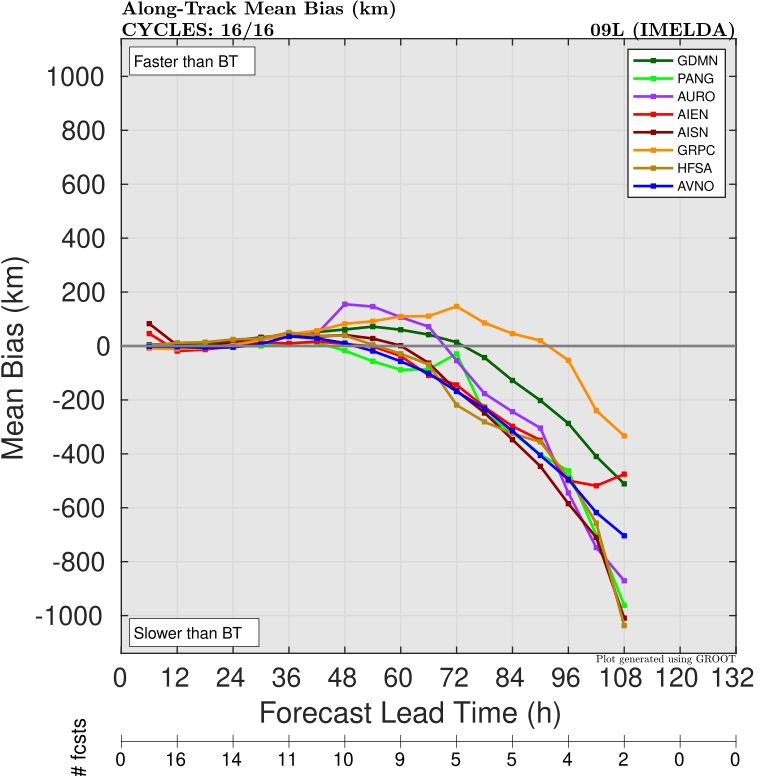
As with Humberto, all models (both AI models and dynamical) had a slow bias (Figure 2), as the observed storm recurved to the East/Northeast a lot faster than forecast. Graphcast was actually the best model for forward speed, with FNV3 a close second.
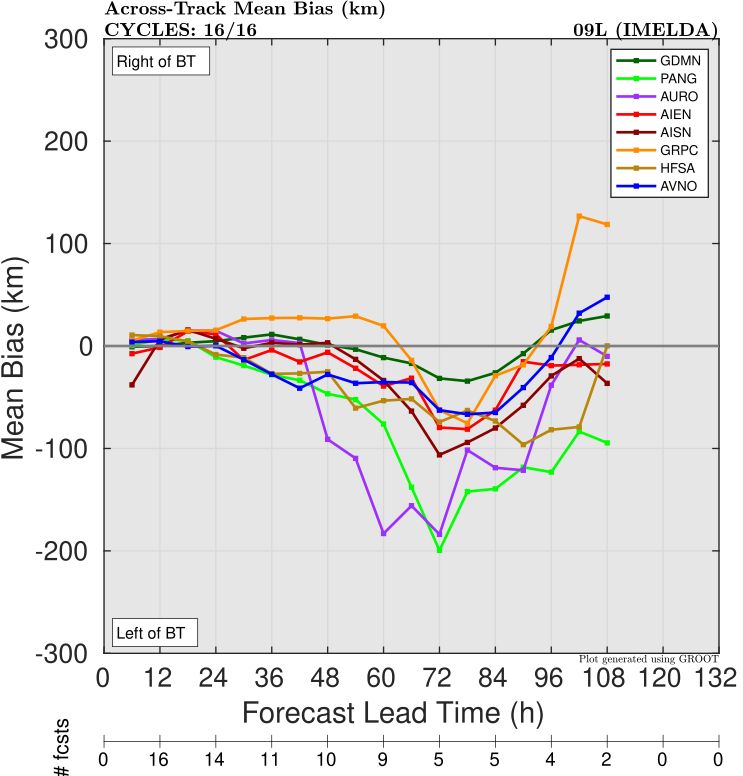
There was also a substantial left of track bias for most models (Figure 3), indicating too much interaction with the upper low and a track too close to the coast. Graphcast was once again a standout here, and actually had a slight right-of-track bias by Day 5. FNV3 was also very good and consistent with only a small left-of-track bias. The previous blog showed that members of FNV3’s ensemble showed both the recurve scenario (correct) and track towards the coast (incorrect), so the ensemble mean was dragged down a little bit by the 2nd group. Given the complexity and uncertainty this setup had, spread was probably a beneficial thing for forecasters.
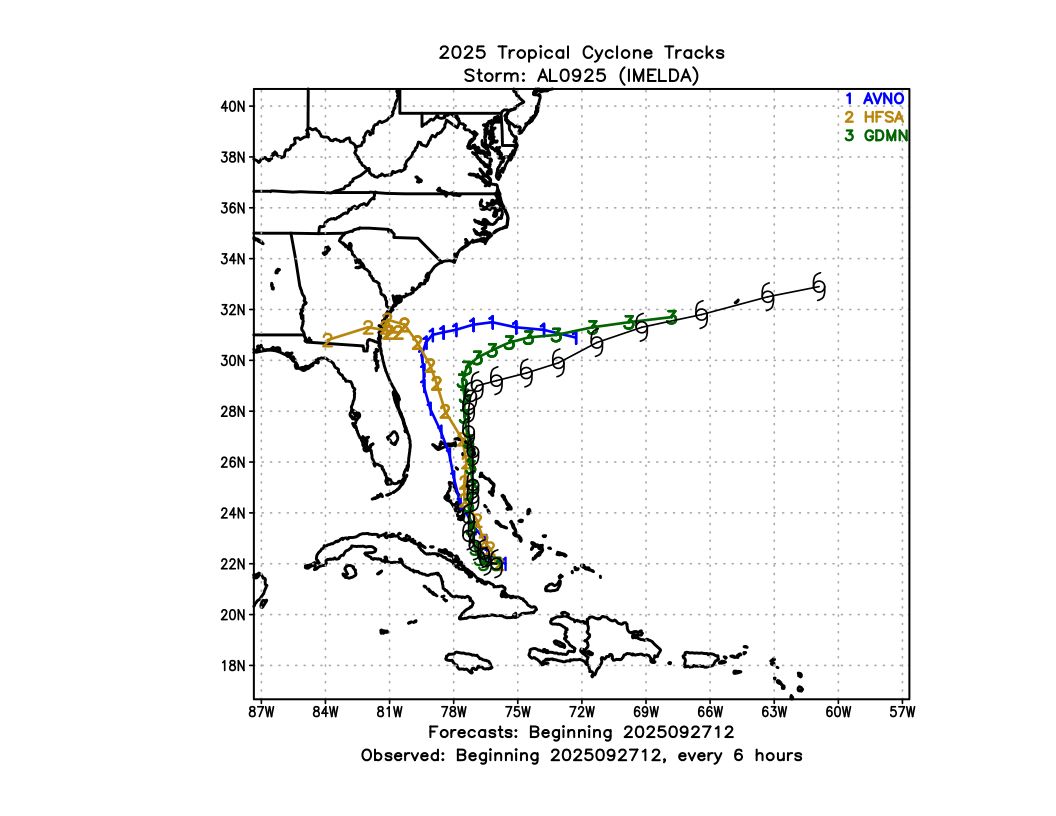
By the time Imelda was classified as a tropical cyclone (which is when the official verification starts), most forecasts had started to correct away from landfall. For some cycles while it was a potential tropical cyclone (PTC), we can see how both GFS and HAFS were too close to the coast while GDMN/FNV3 were more accurate with the recurve track (Figure 4).
Intensity
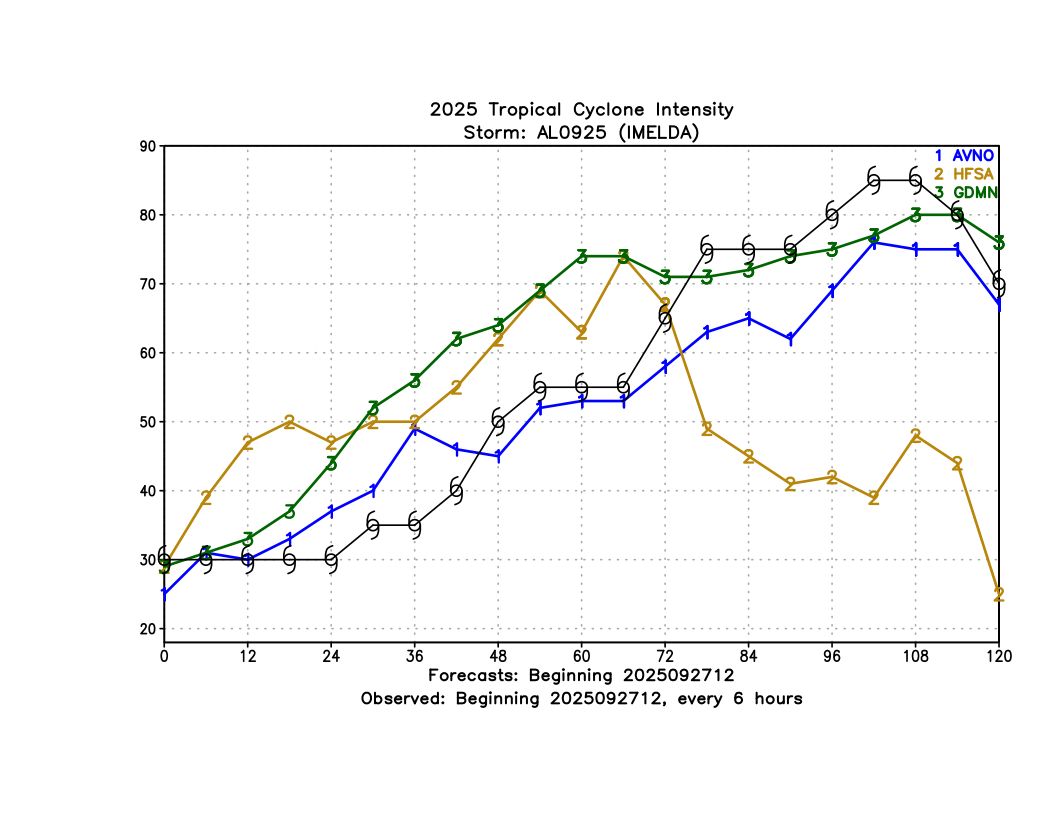
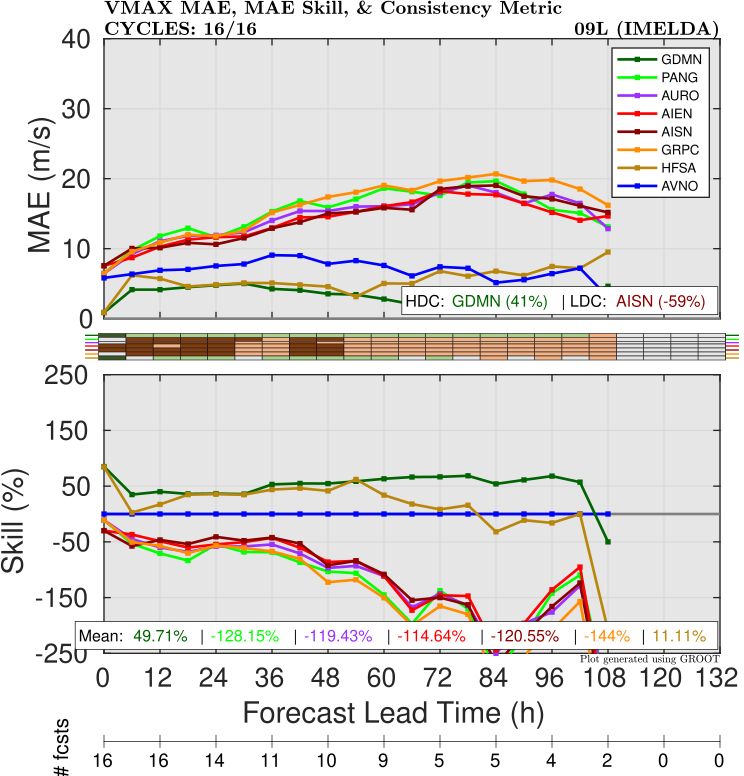
As with Humberto, most AI models were not very accurate with intensity for Imelda, but Deepmind/FNV3 performed quite well, beating GFS and even HAFS at almost all forecast lead times (Figure 5).
Further examination of some of the individual runs (Figure 6) shows that both HAFS and GDMN predicted the intensification rate fairly well. After Day 3, GDMN had a much better intensity because HAFS incorrectly went inland and weakened, while in reality the storm stayed over water. This shows the connection between track and intensity errors and that getting the former right helps improve the latter.