
 Expand
We’re big fans of Google’s WeatherBench, which has enabled us to compare AI weather forecast models against each other and traditional weather models on global error and skill metrics.
We noticed that each new AI model paper would compare on error and skill, and include perhaps one or two case studies of specific weather events. Case studies are great, but they are a lot of work to produce and challenging to compare across models. We wanted a benchmark that allows you to compare your forecast to other models across an extensive suite of high-impact Extreme Weather cases. We want to enable you to see how your model will perform on the most memorable weather for different locations. So we built a whole new benchmarking suite - Extreme Weather Bench (EWB).
Extreme Weather Bench is a community-driven set of case studies, data, metrics, and code that enable you to evaluate your models on a variety of high-impact weather. It is both a benchmark and the tooling to use the benchmark. EWB is open and free, and contributes to Brightband’s mission as a Public Benefit Corporation to accelerate AI Weather Innovation, and provide AI Weather tools to all.
Amy McGovern (Brightband advisor and University of Oklahoma Professor of Meteorology & Computer Science) assembled a global team of evaluation experts with Daniel Rothenberg (Brightband Head of Data and Weather), including:
- Nicholas Loveday, The Bureau of Meteorology, Australia
- Corey Potvin, NOAA NSSL
- Montgomery Flora, The Weather Company
- Linus Magnusson, ECMWF
- John Allen, Central Michigan University
With the help of Taylor Mandelbaum, we’ve built a benchmark and tooling that is:
- A few lines of code to run
- Community-driven
- Open-source
- Lightweight library (pure python)
- Impact-based metrics
- Provides case studies and data
- Evaluates across event categories
- Dives deeply into a single event or groups or regions
Different Extreme Weather categories can be evaluated on both reanalysis or other types of targets such as:
- Tropical Cyclones: IBTrACS
- Severe Convection: Local Storm Reports and Practically Perfect Hindcasts
- Hot/Cold: Global historical climatology network
- ARs: ERA-5
Across all the Freeze Events in EWB’s cases, you can compare how different models perform, on the Mean Absolute Error (MAE) for Temperature targets:
 Expand
For ARs you can see comparisons across all cases for Critical Success Index (CSI) which measures how accurately ARs are detected in terms of hits, misses and false alarms, and Spatial Displacement measuring how well they are located. You can see here that AI models are generally doing better than the benchmark traditional forecast IFS HRES, and that they do a comparatively better job on detection than location.
 Expand
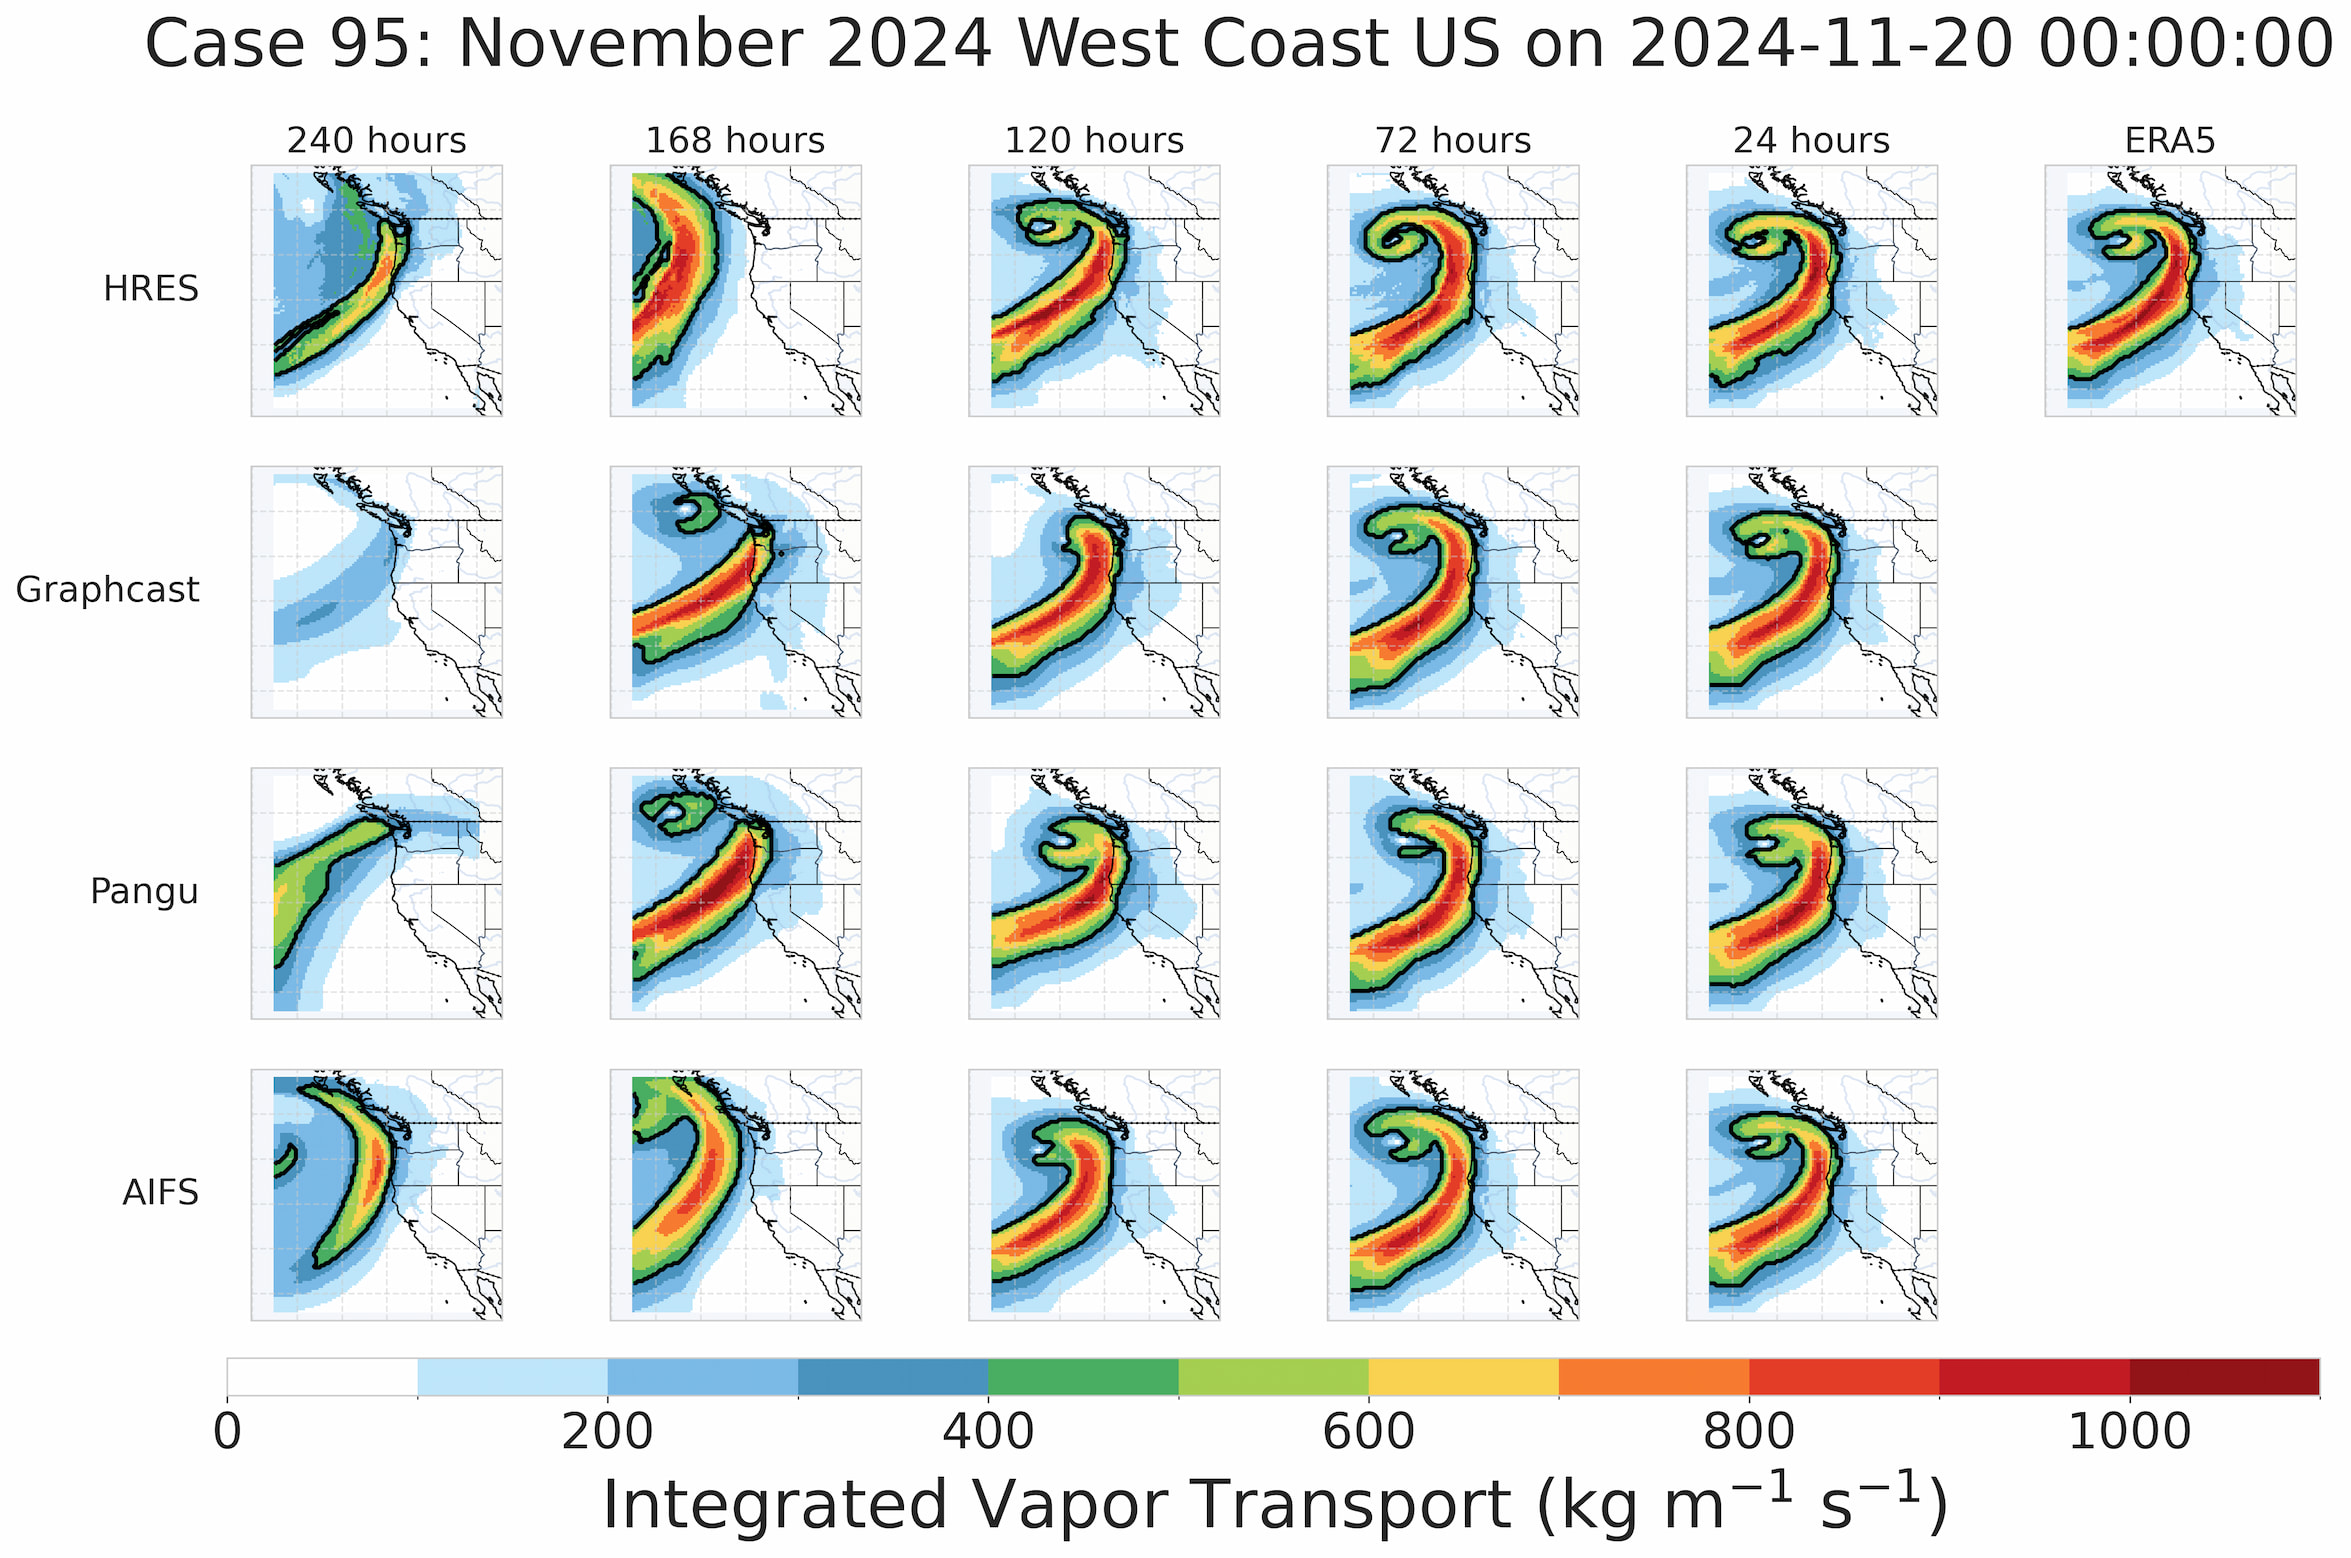
You can dive into a single Case Study and compare model performance, e.g. an Atmospheric River hitting the West Coast of the USA in November 2024. You can see that the different models start picking up the structure of the AR with different lead times, with AIFS and HRES doing the best job 10 days out.
Expand
You can add different Extreme Weather categories, and add events to existing categories (e.g. recent hurricanes).
We encourage any organizations who have data on extreme events to share it with EWB to enable truly global comparison of forecast model performance on extreme events. This will accelerate innovation benefiting all, strengthening Pillar 2 of the World Meteorological Organization’s “Early Warnings for All” initiative.