
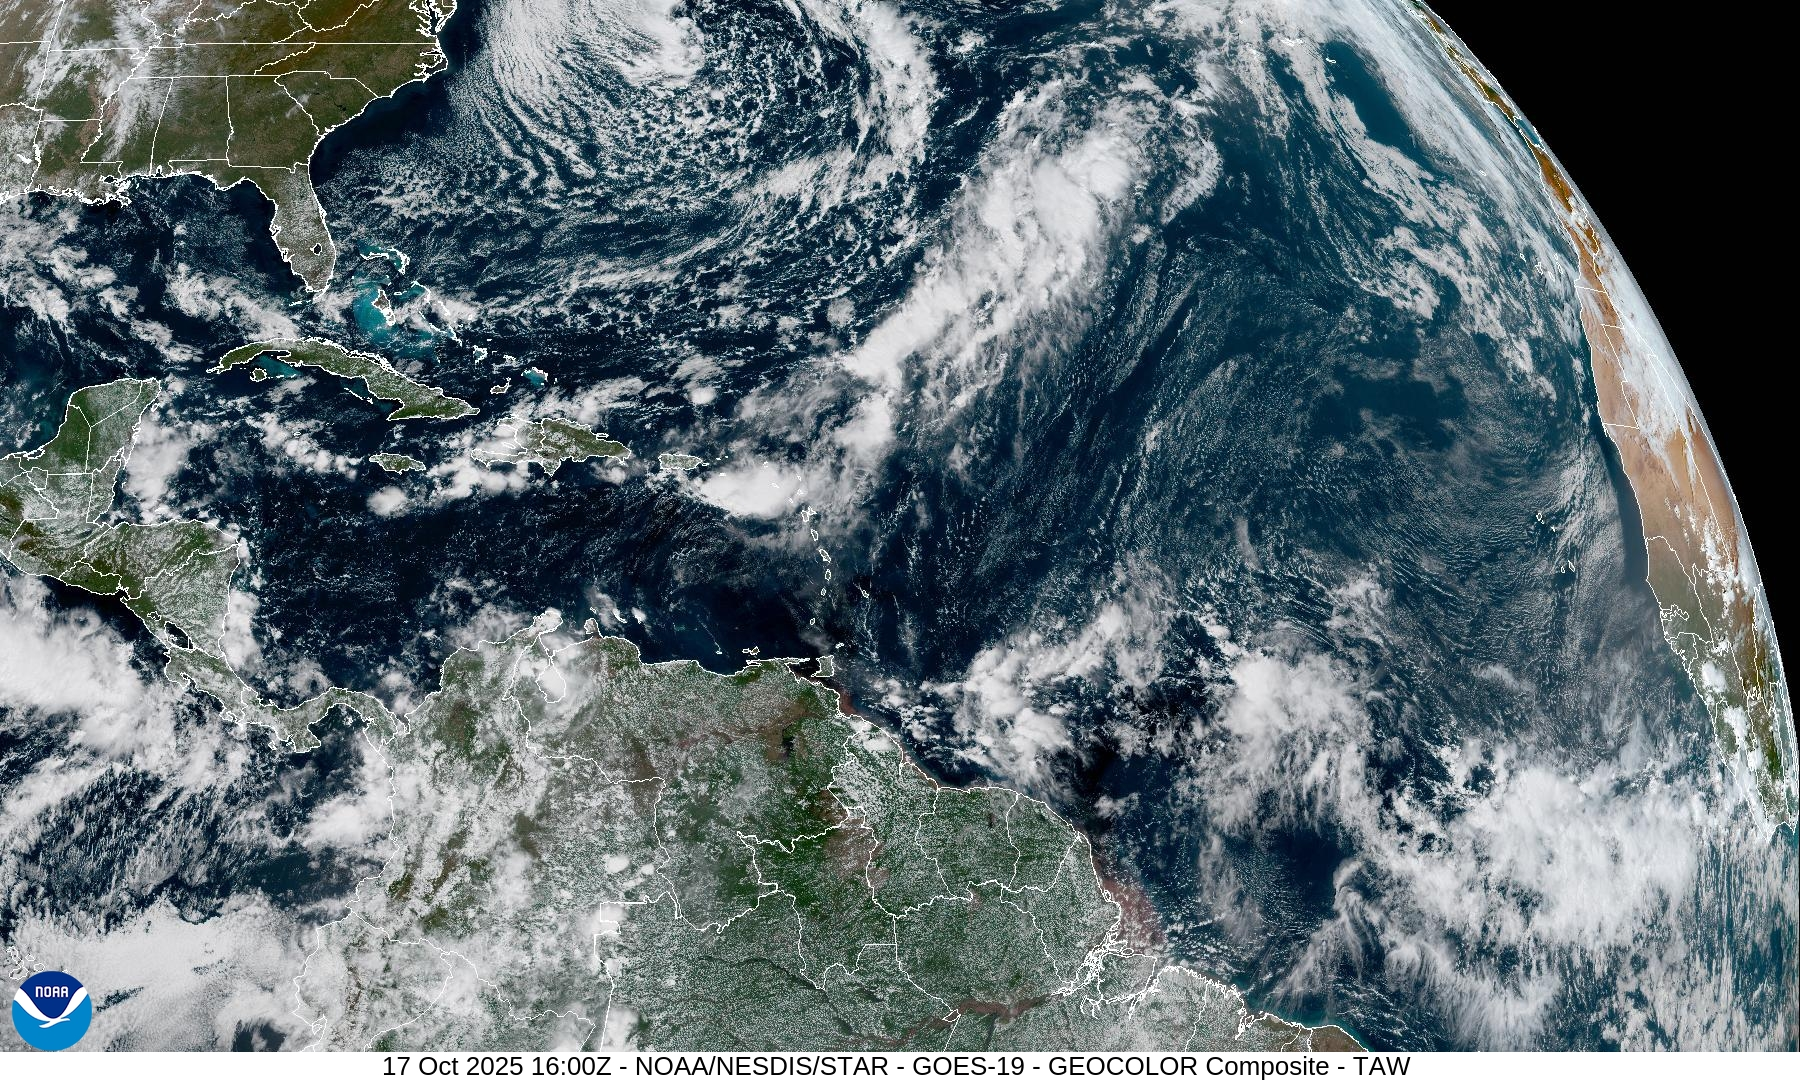
What’s Coming in the Caribbean? AI Models Discussion 10-17-2025
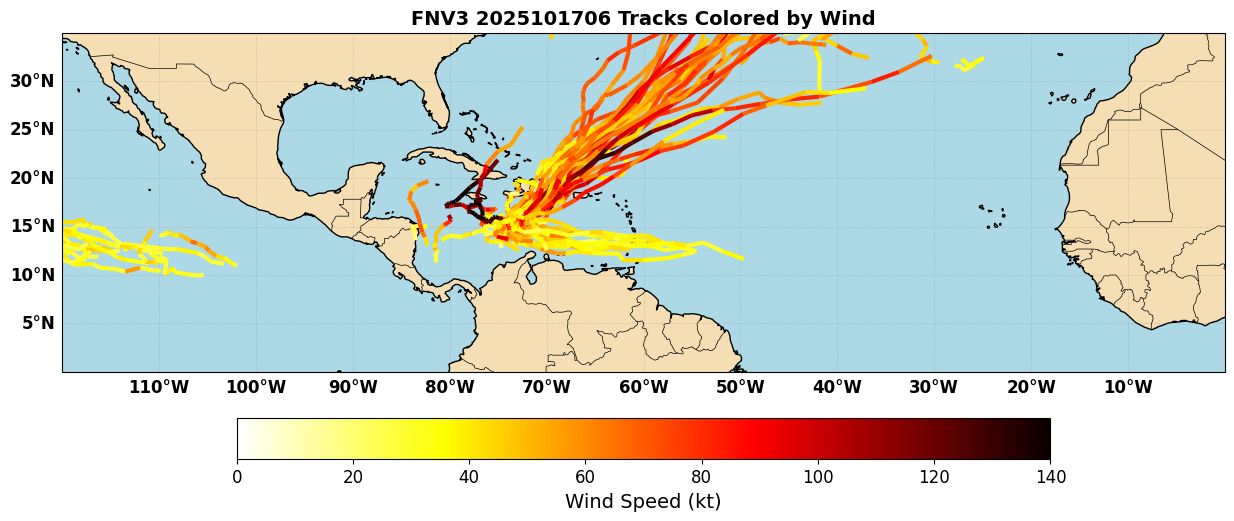
A strong tropical wave is located around 40W this morning, and given a 30% chance of development in the next 7 days by the National Hurricane Center. The system will move into the East/Central Caribbean. From there, models diverge fairly significantly on the evolution of the system. Compared to yesterday, there has been an eastward trend with more models/ensembles developing the system quicker and recurving it quickly to the NE towards the Dominican Republic, Haiti, or Puerto Rico (Figure 1), in line with the operational GFS model. However, some ensemble members still have a slower track more towards the NW Caribbean, in line with the operational ECMWF model.
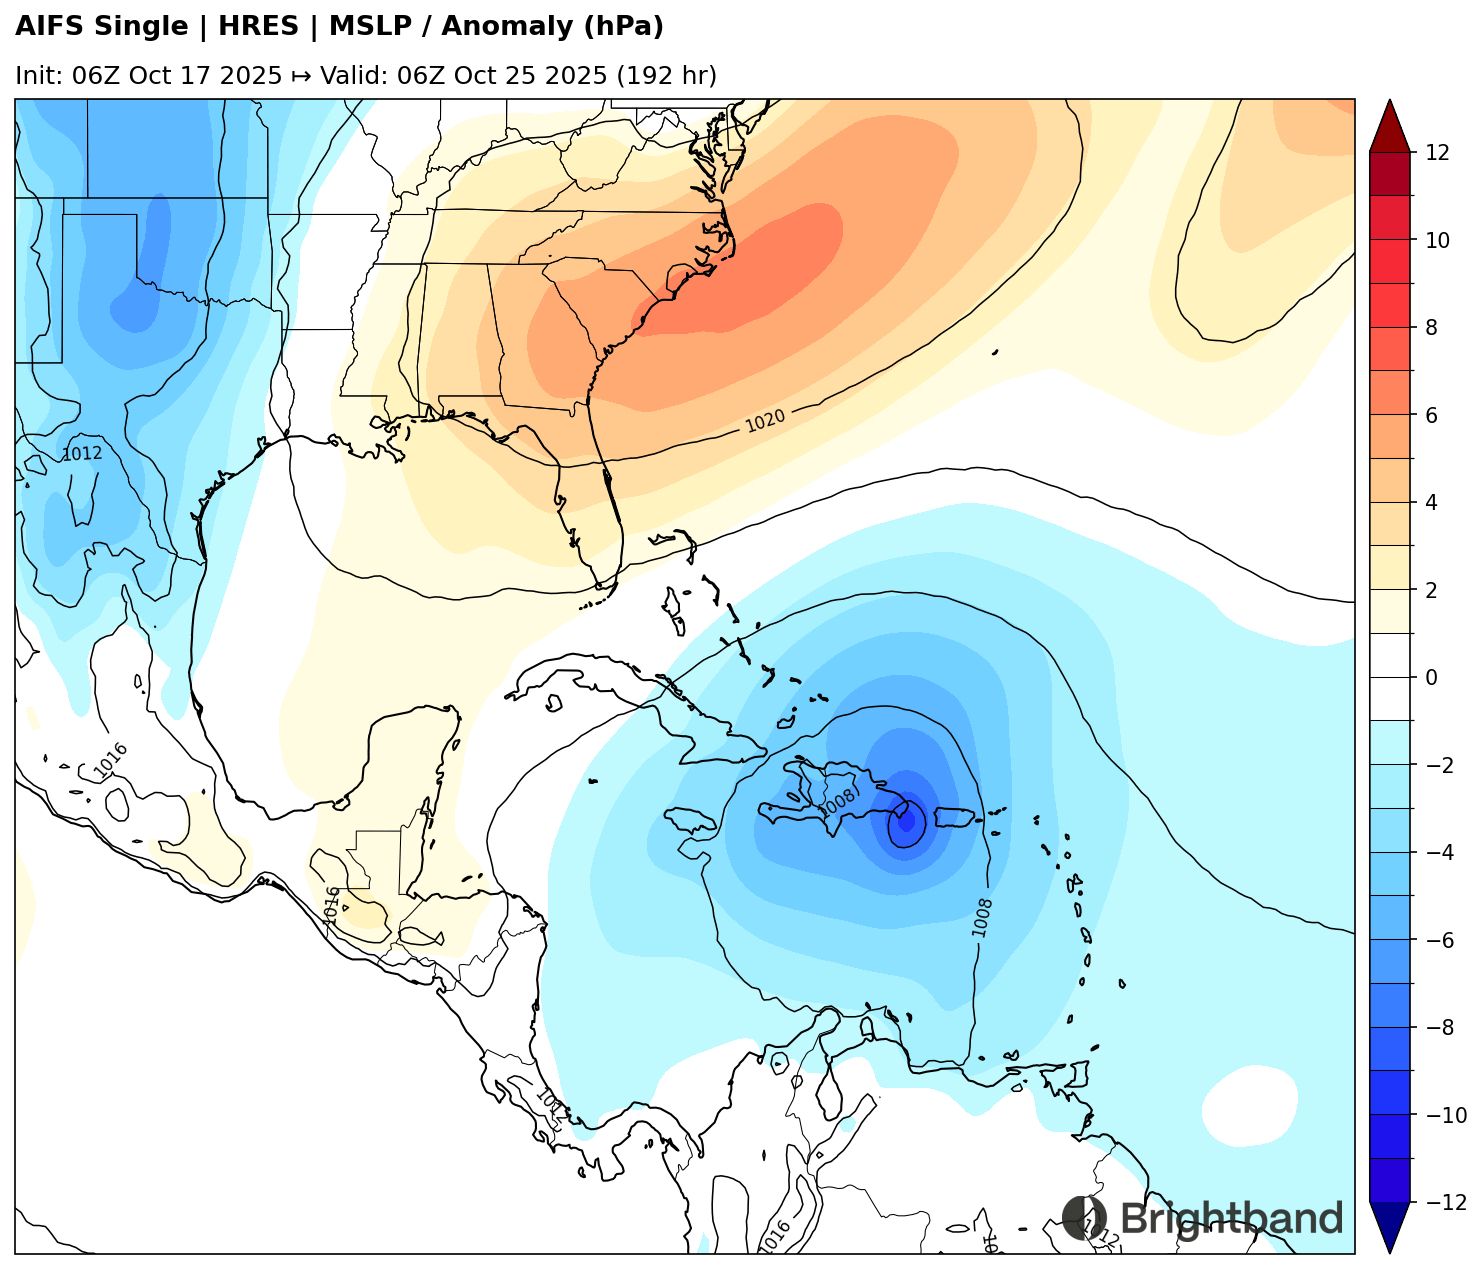
There are also some large discrepancies in the AI control runs. For example, if we look at forecasts in approximately 8 days, AIFS is similar to most of the FNV3 members, with a TC moving across the Eastern end of the Dominican Republic. Sharp NE tracks across the Antilles are not unheard of late in the season. Examples include Hurricane Tomas (2010) or Hurricane Omar (2008).
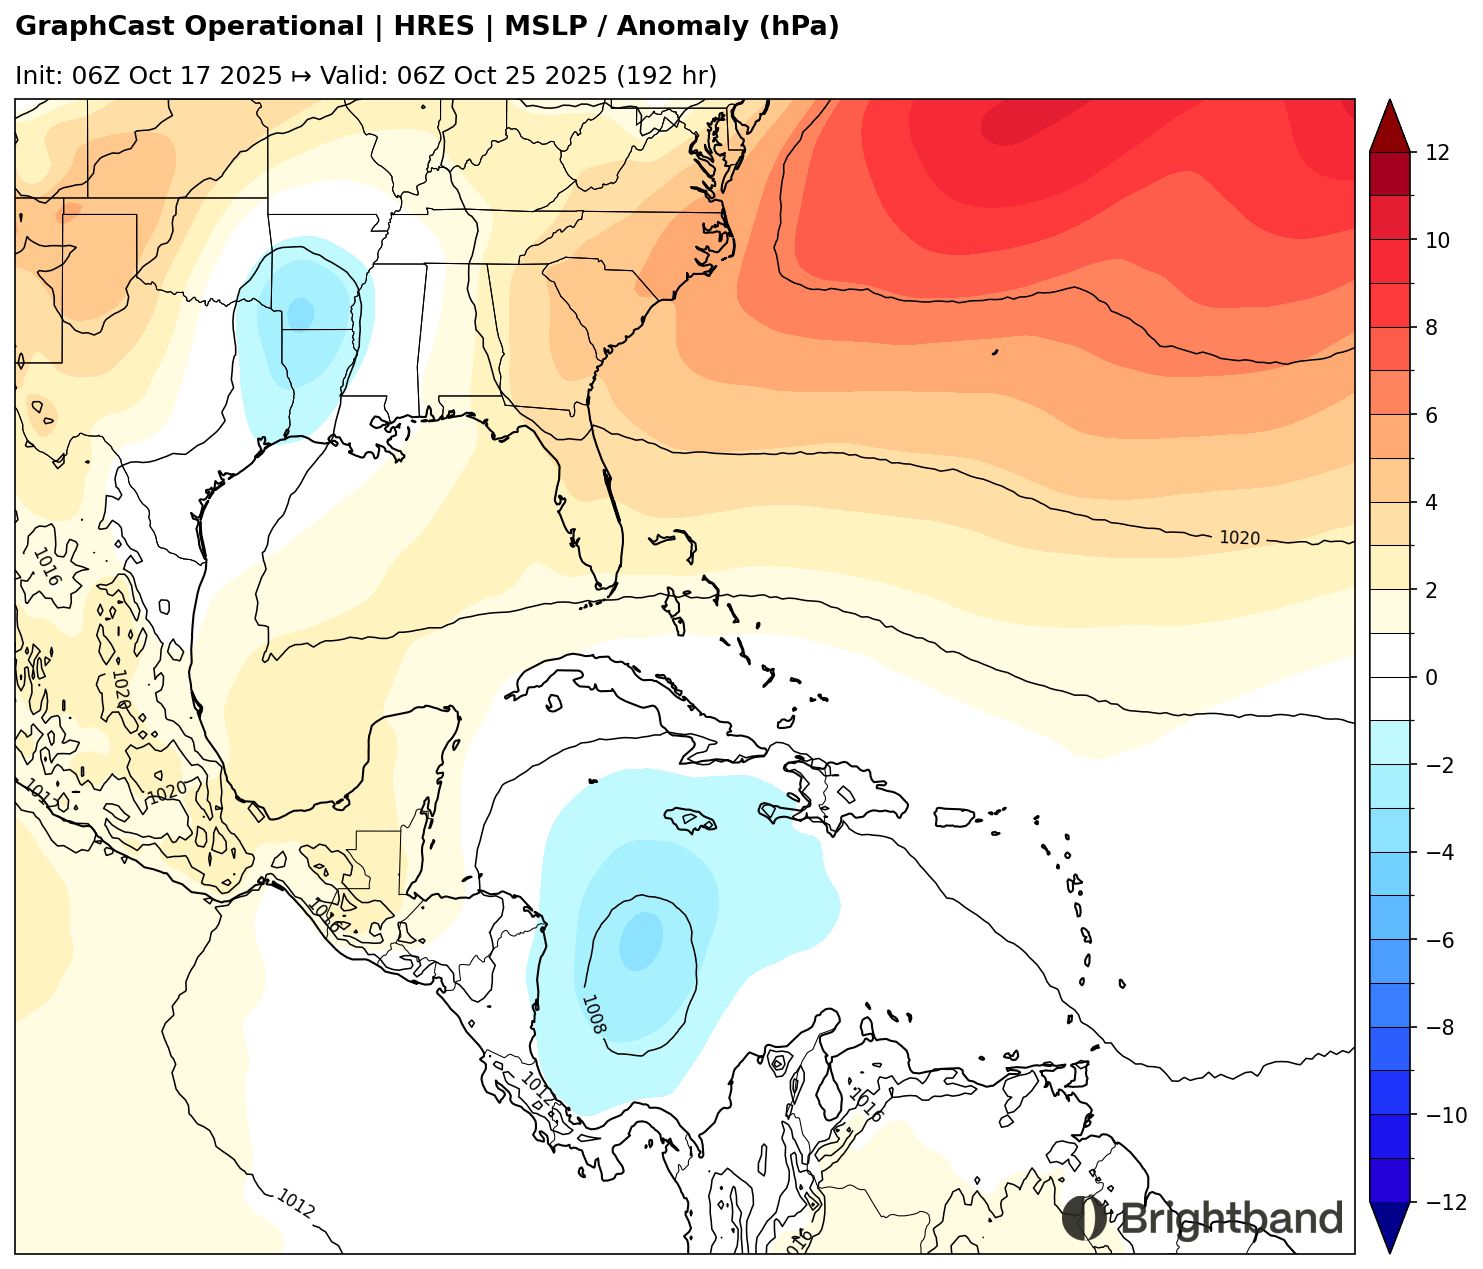
On the other hand, GraphCast shows a track that is further SW, with a weaker low over the SW Caribbean East of Honduras. This sort of track with a TC meandering around the Western Caribbean is also fairly common this time of year, with examples including Wilma (2005) and Mitch (1998).
So what’s driving these differences? That might give us some clues as to which solution is more likely as we head into the weekend. One of the biggest differences seems to be intensity. AIFS has a more robust wave/low moving into the Eastern Caribbean in 3-4 days (Figure 4), while GraphCast has a weaker low (Figure 5).
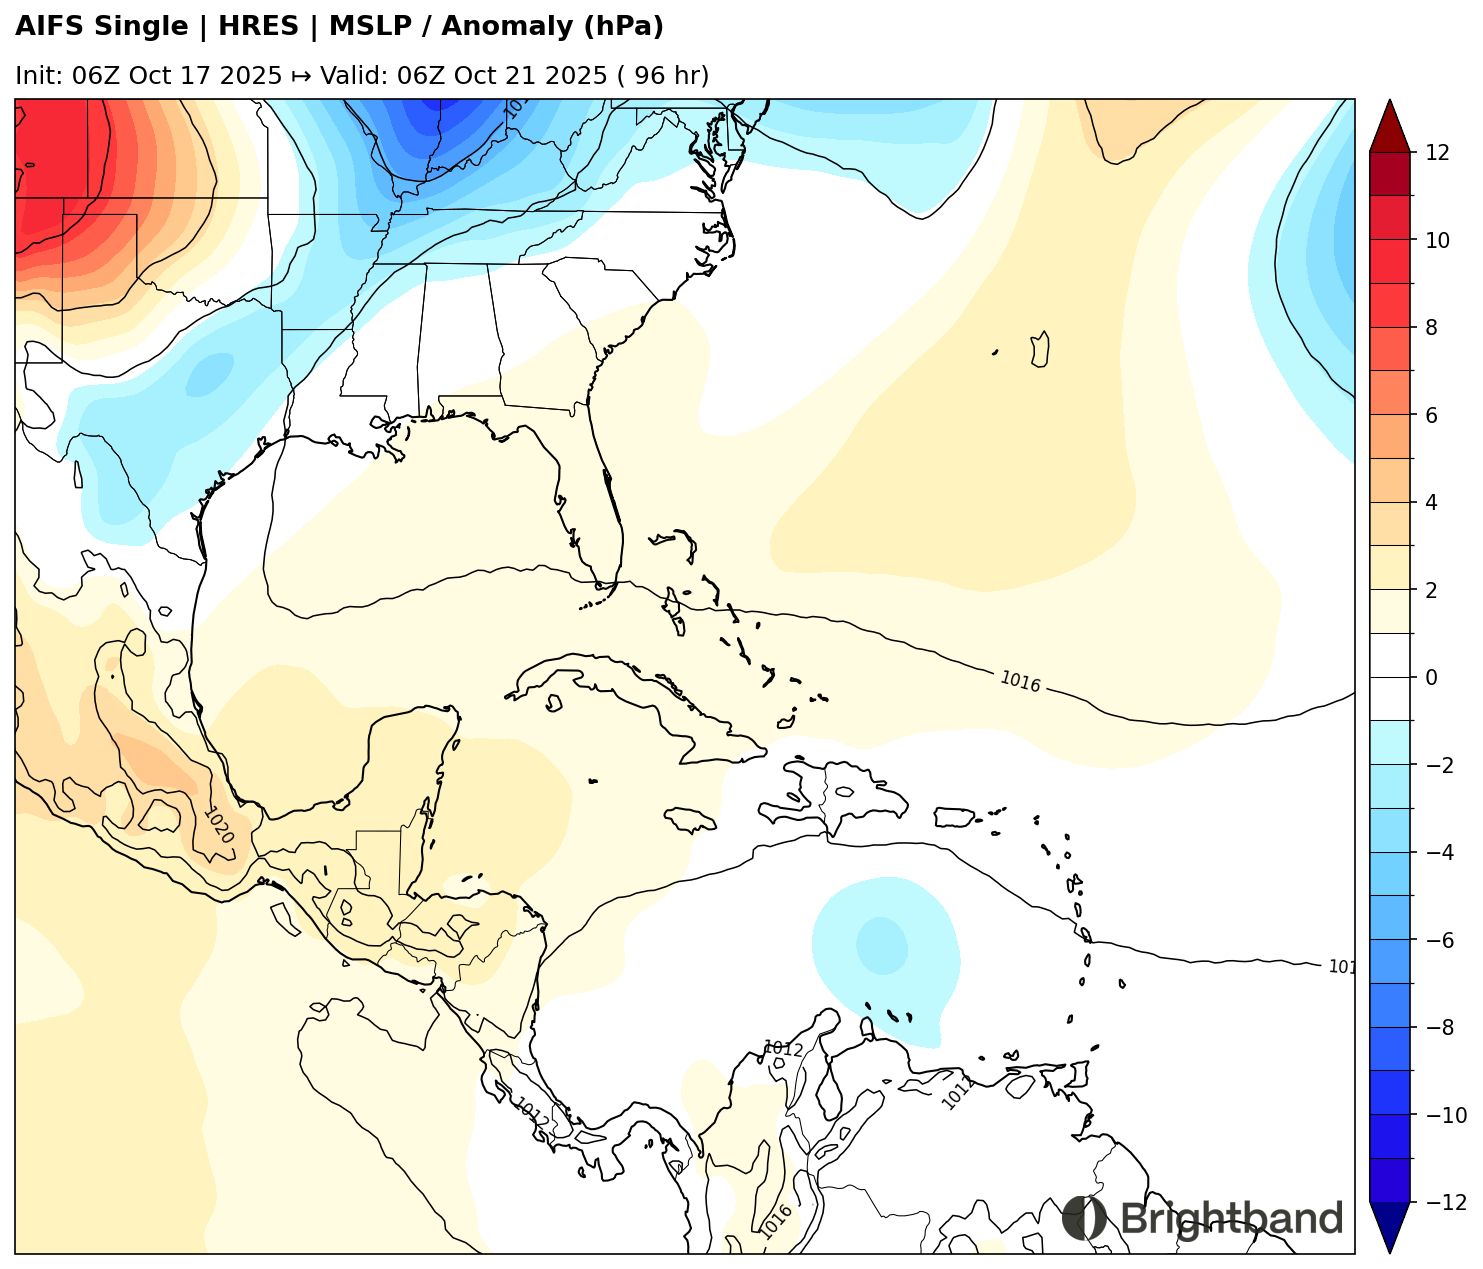
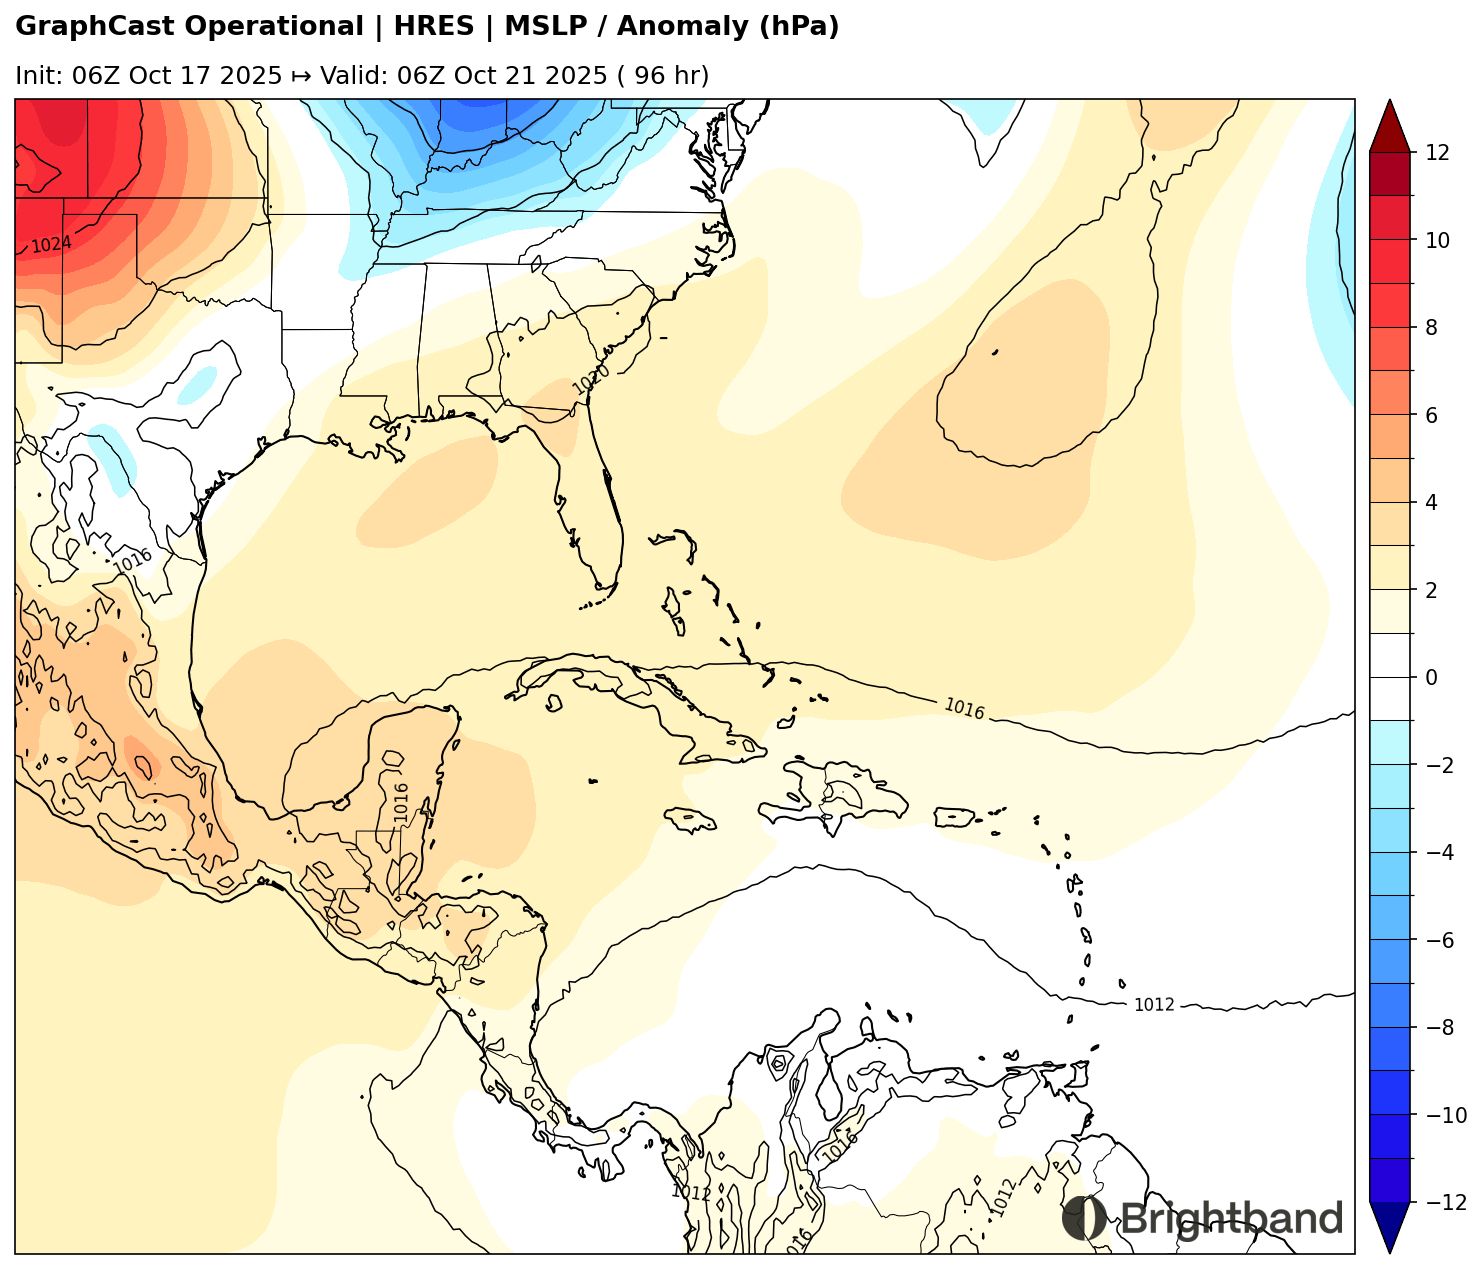
The weaker system is less likely to feel a weakness in the ridge (which we’ll talk about next) and continue in the low-level trade flow to the west. The wave is currently producing some robust convection and showing some signs of organization, which may be why models have been trending towards a deeper system that turns more quickly. There’s still a lot of uncertainty, however.
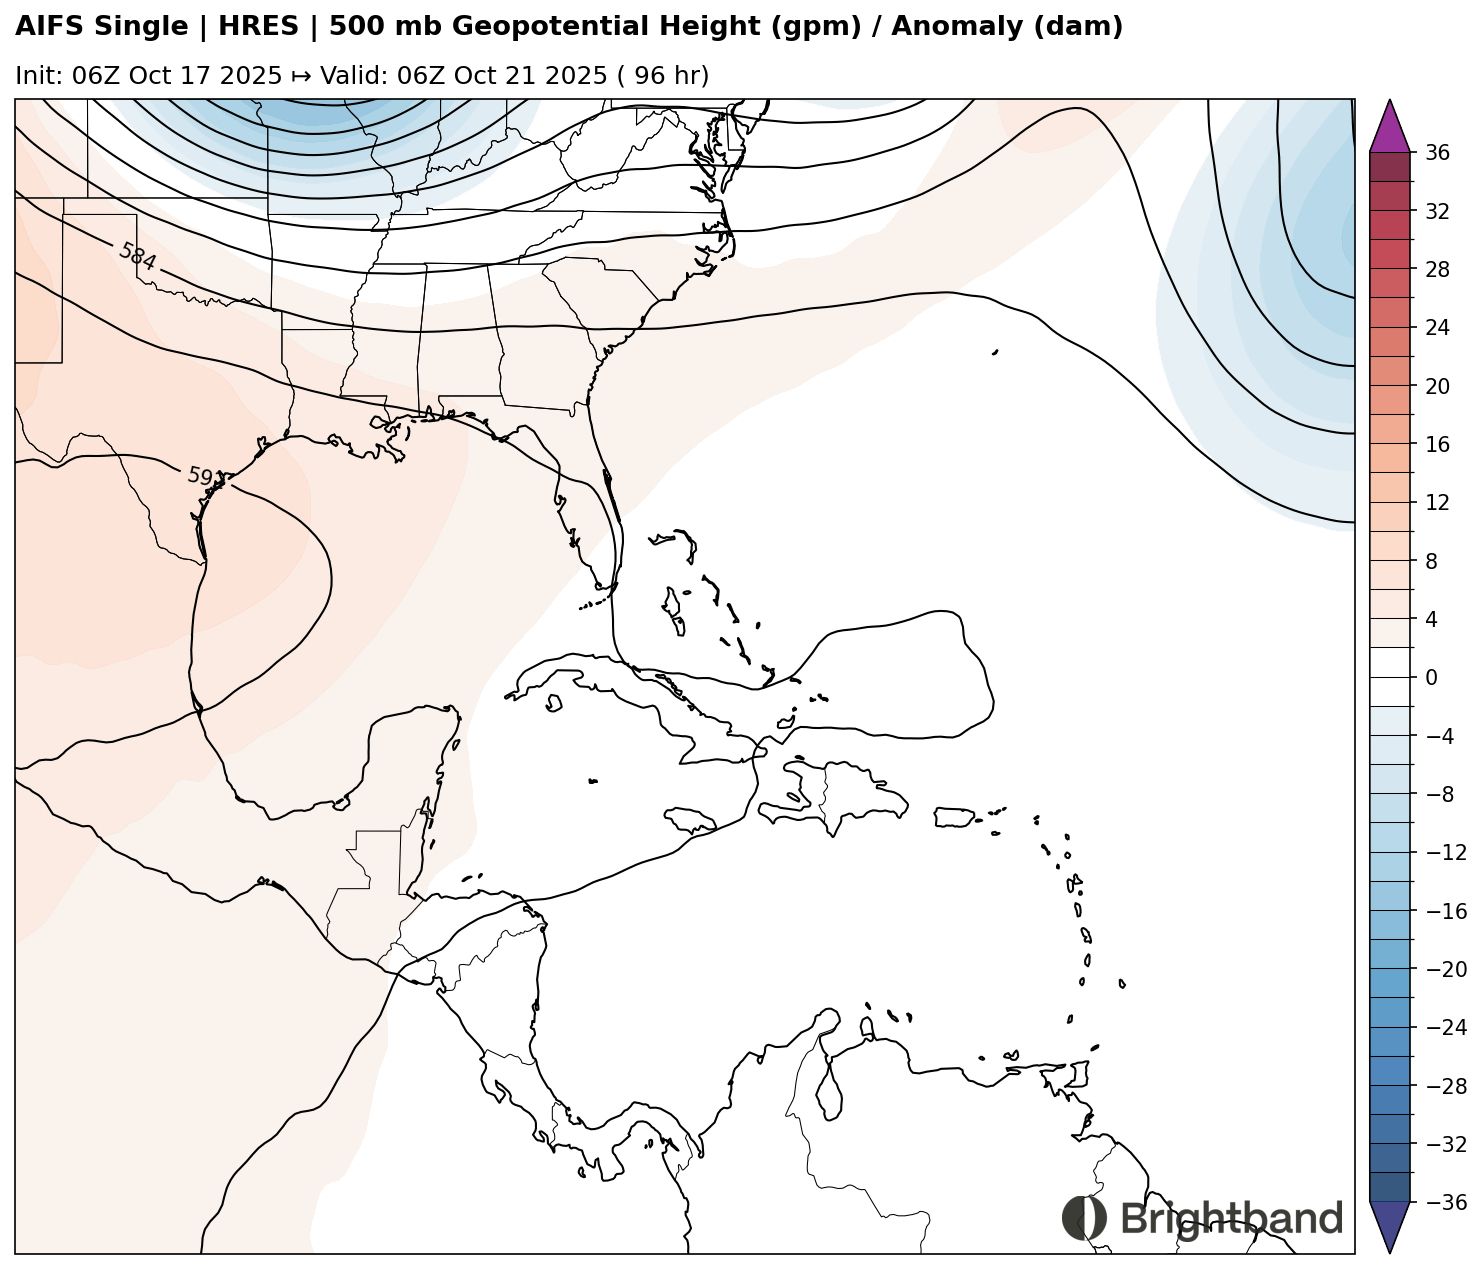
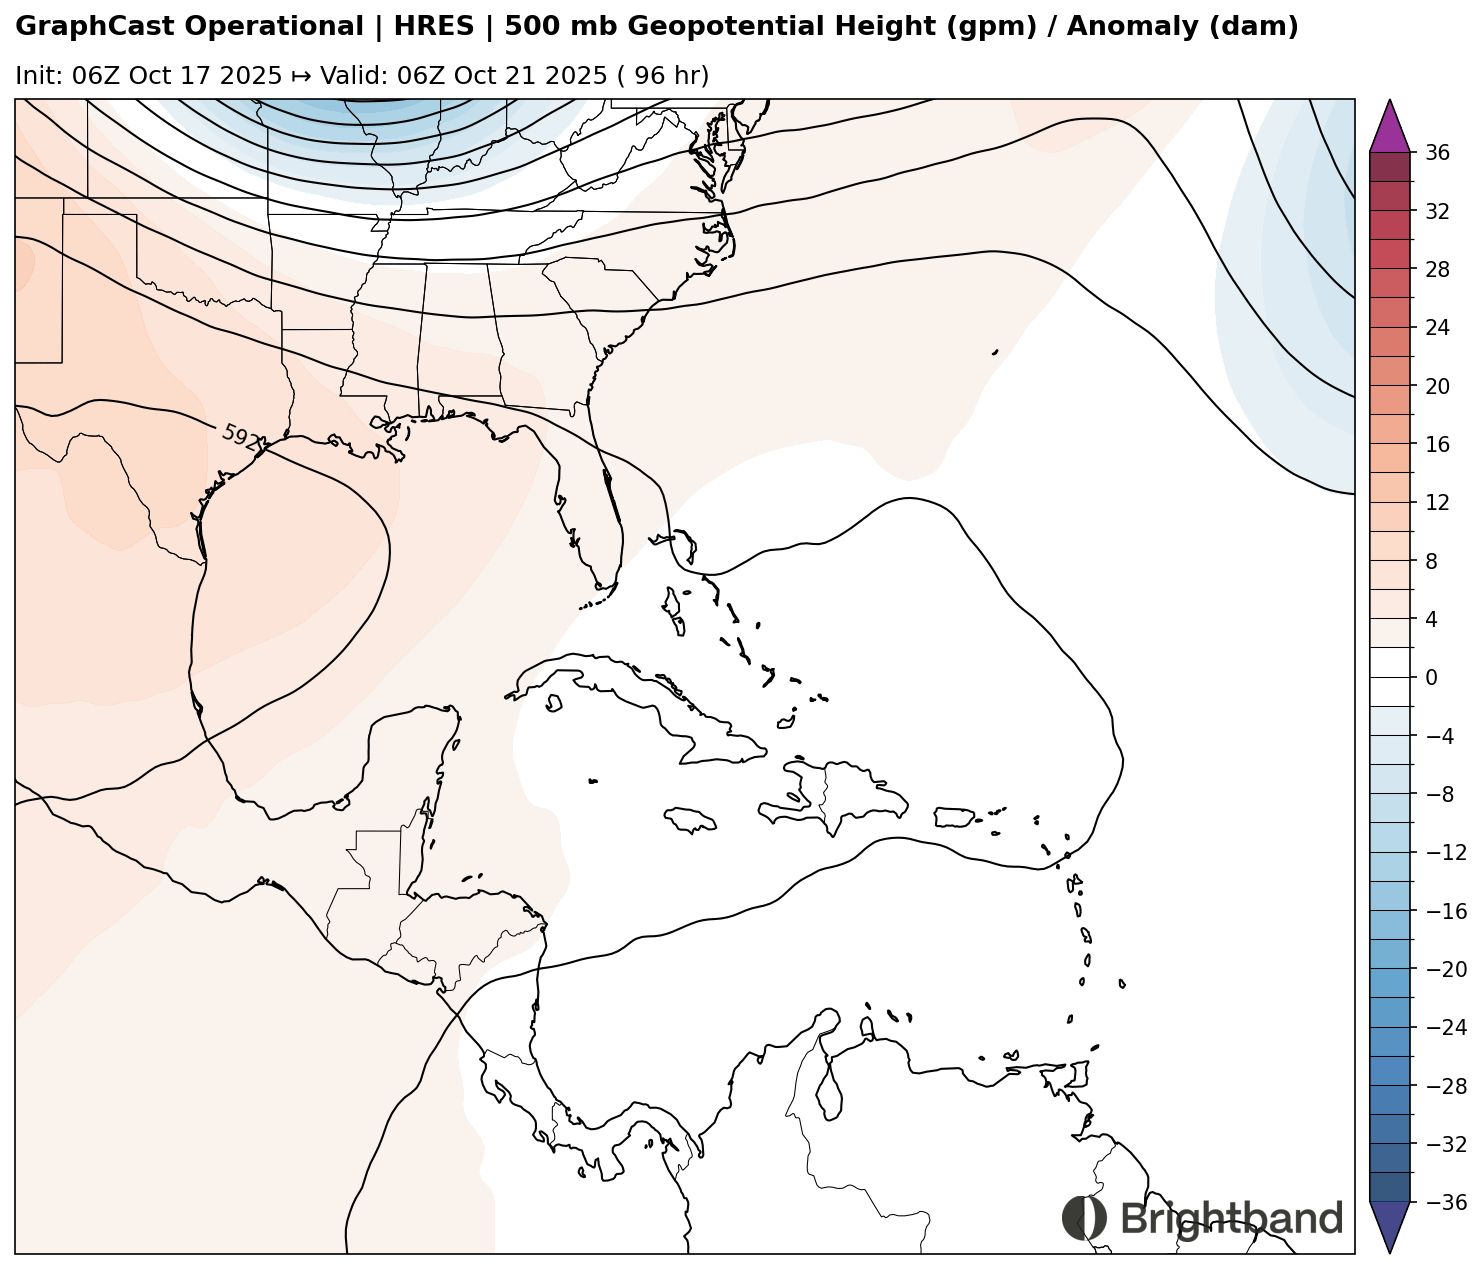
Part of the remaining uncertainty stems from synoptic differences. AIFS (Figure 6) has a stronger trough over the Central Atlantic in 4 days, with residual weakness north of the Antilles. In contrast, GraphCast shows the trough over the Central Atlantic lifting out more quickly, allowing the flank of the Mexican ridge to build north of the Caribbean and help trap the storm and prevent it from recurving immediately.
The Central Caribbean looks generally favorable for development and intensification, with shear decreasing and SST well above average. So it will be important to see which solution ends up correct to see what areas might be at most risk from this TC, how much time it will have to intensify, and what the timing will be. Hopefully we’ll get some clarity over the weekend.