
What’s Coming Behind Gabrielle? Atlantic Model Forecast Discussion 9-19-2025
I am currently in Puerto Rico getting ready to fly missions into Tropical Storm Gabrielle starting tomorrow! Gabrielle is slowly getting more organized over the Southwest Atlantic. It is forecast to move East of Bermuda and intensify as it does so (Figure 1).
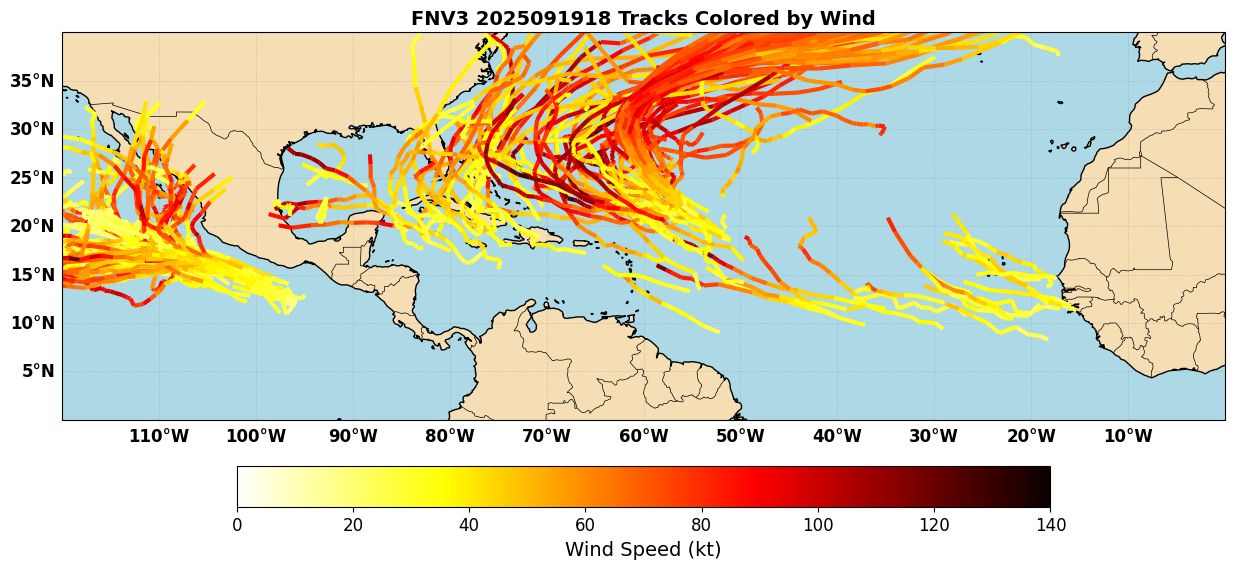
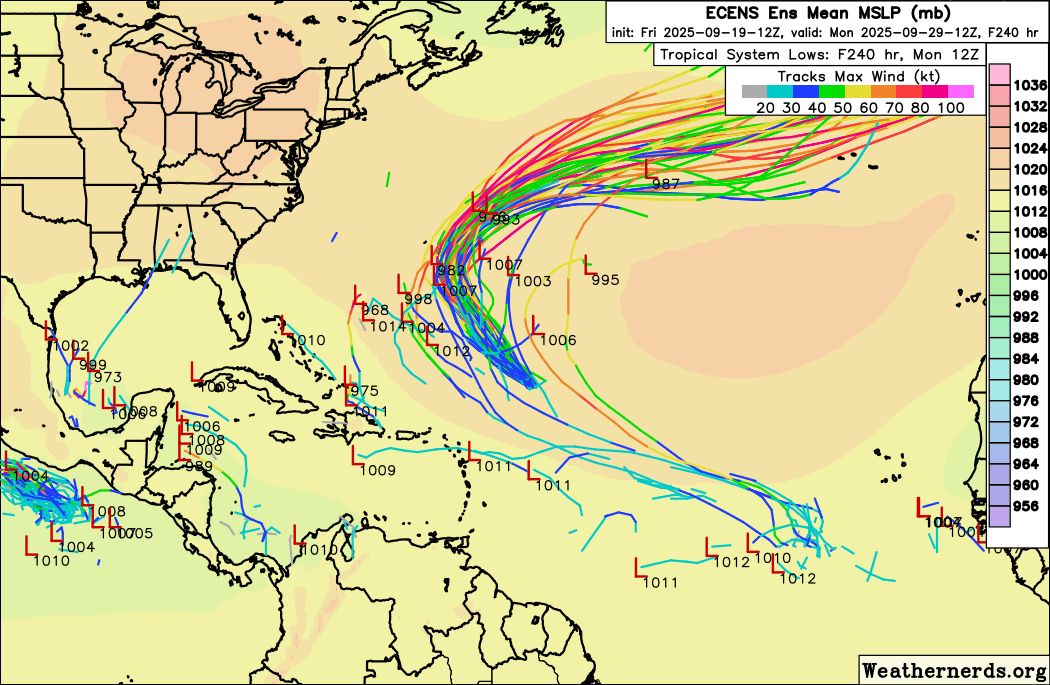
Behind Gabrielle, it’s not clear whether the Atlantic will slow down or continue to be active. There is some discrepancy between the AI models and physics-based models on this question. As Figure 1 shows, Deepmind is very active with two waves in the Central Atlantic developing into tropical cyclones further west, over the NW Caribbean or Southwest Atlantic. On the other hand, the ECMWF ensemble (Figure 2) is much quieter.
This discrepancy extends to the control forecasts as well. AIFS, for example, shows two storms developing in the NW Caribbean/SW Atlantic by Day 10 (Figure 3).
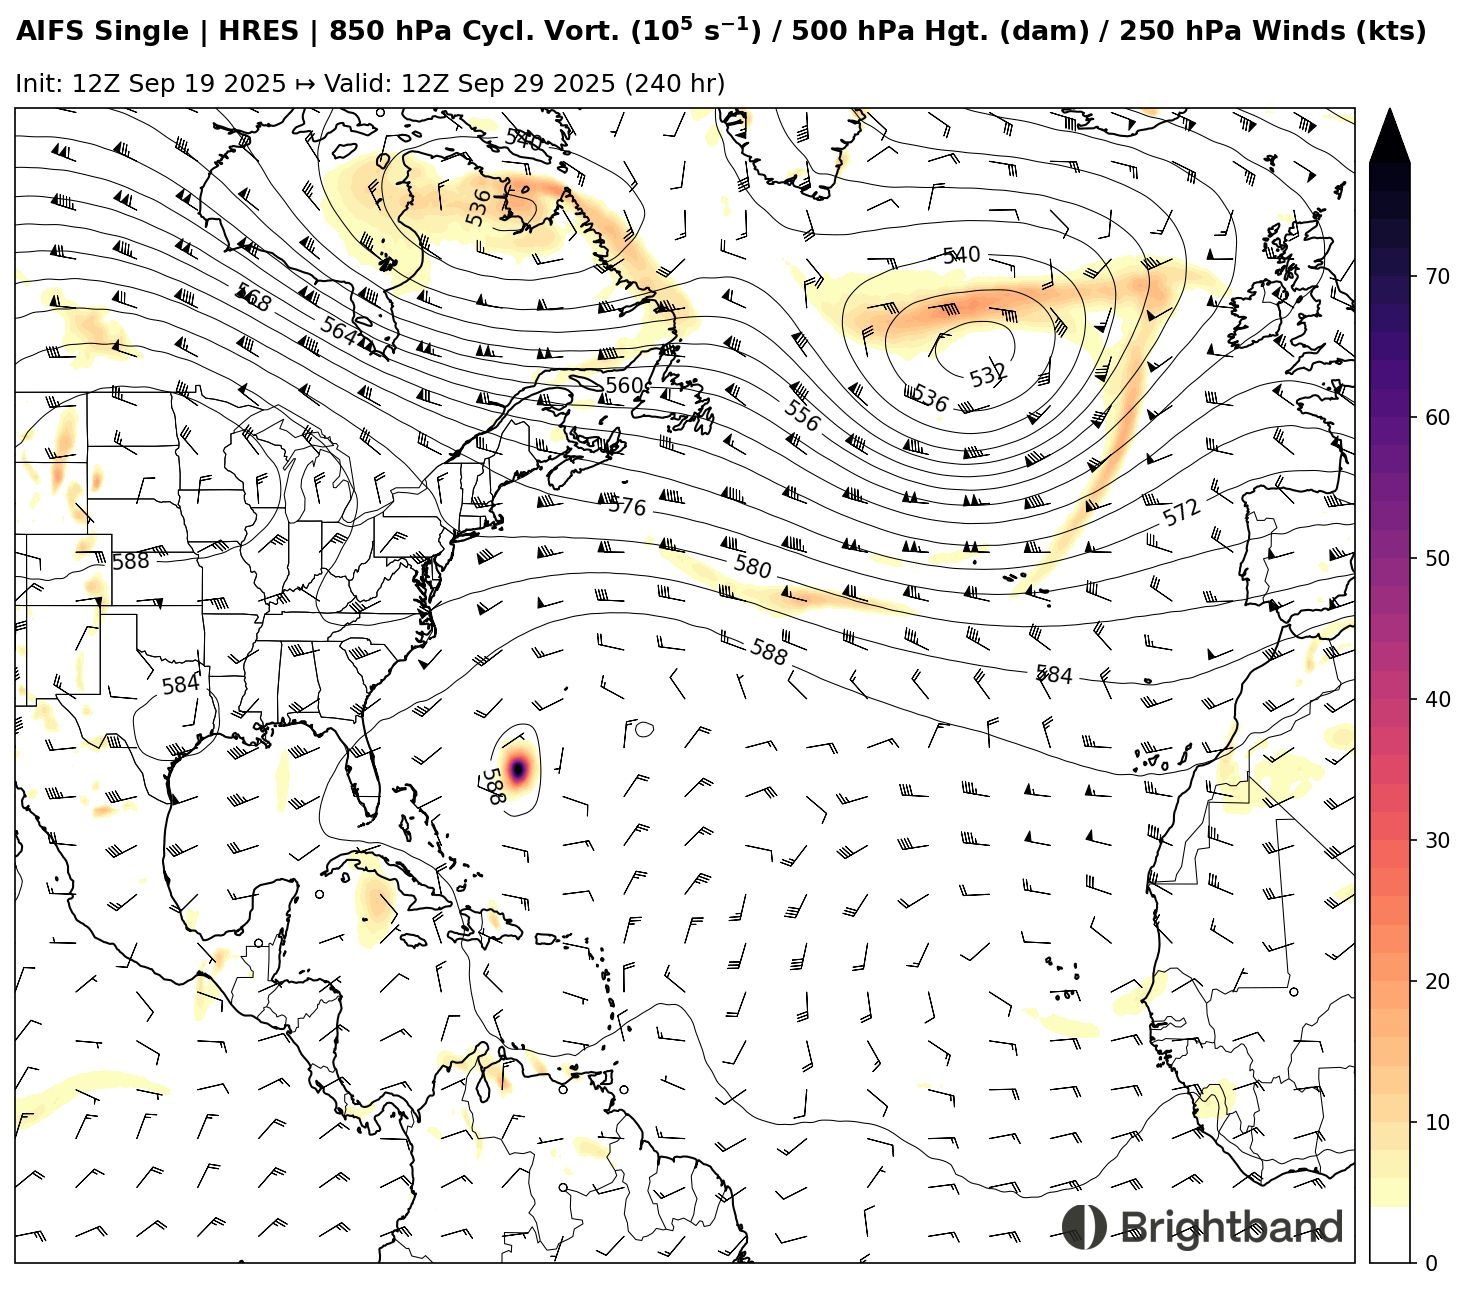
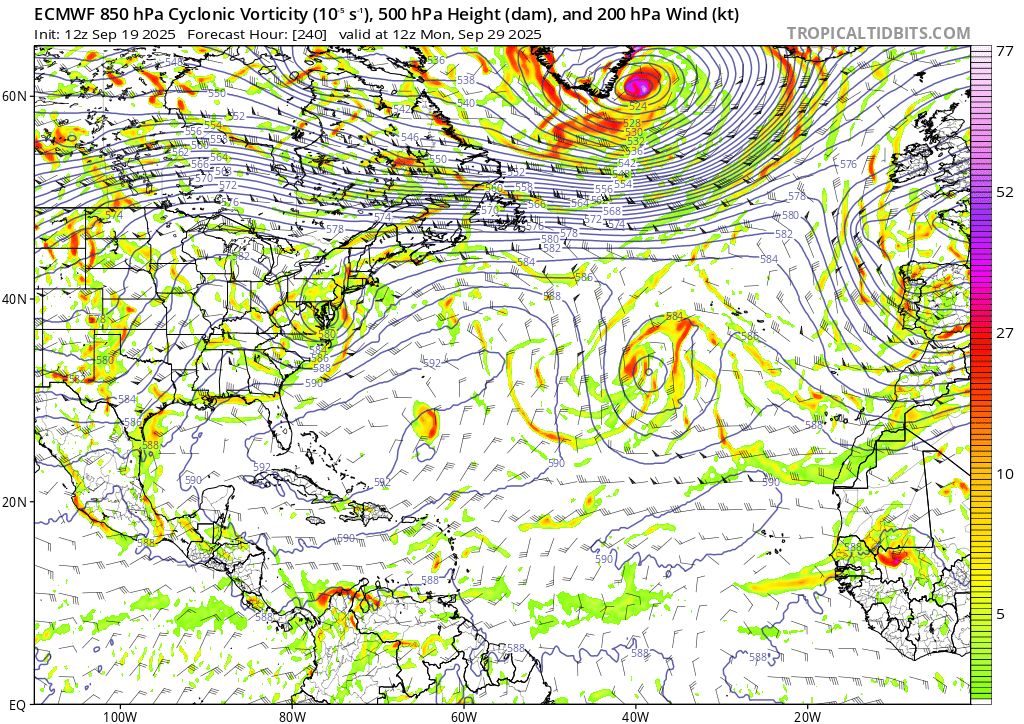
ECWMF and GFS (Figure 4), however, are much more tepid with development. It is worth noting that this is on the edge of the predictability range of our current models (NHC genesis forecasts only go out to Day 7), so it will be worth monitoring to see if things evolve as we move up into a closer time window.
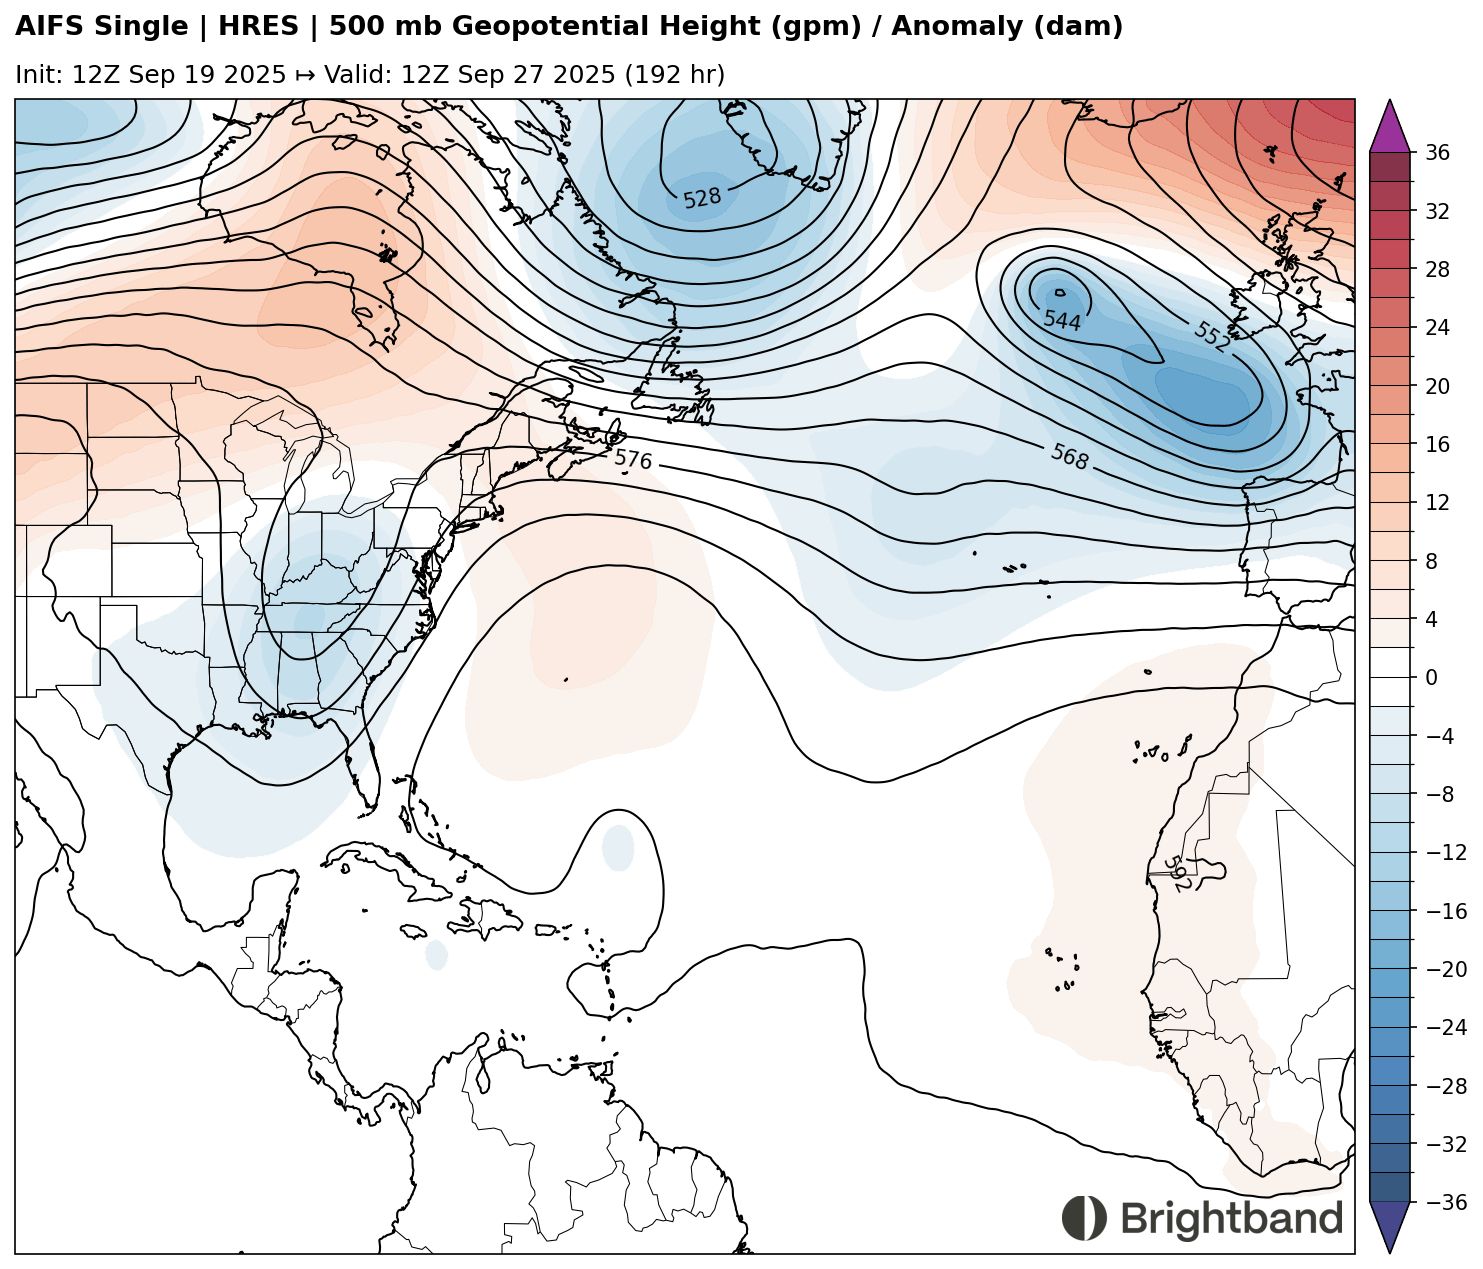
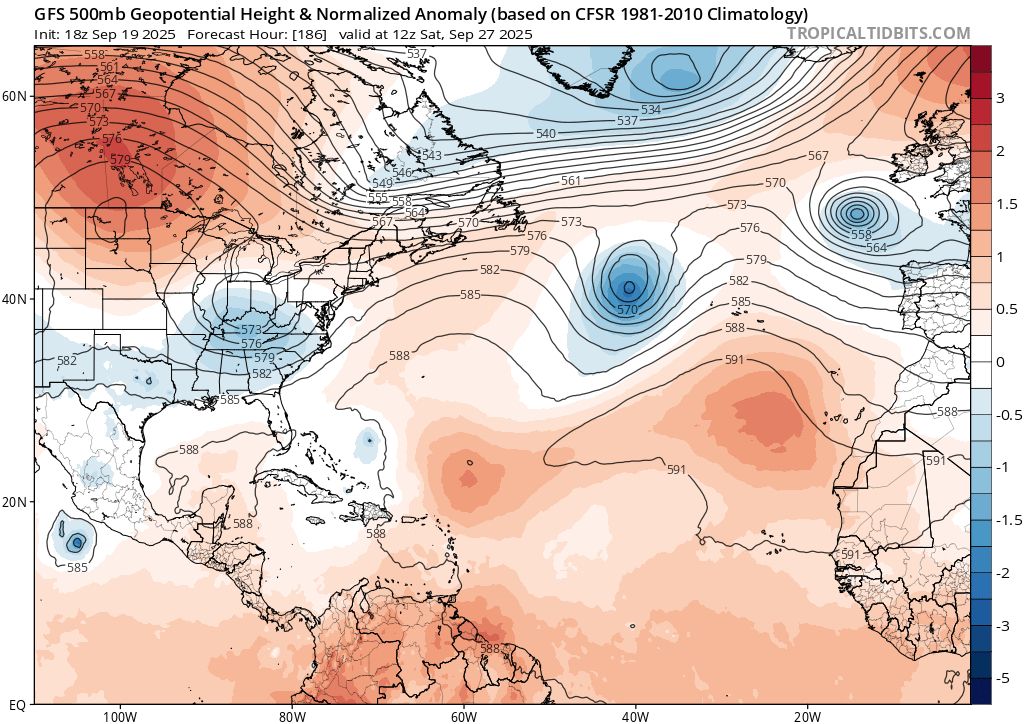
It is not immediately clear what the source of this discrepancy is. AIFS seems to have a stronger ridge to the north (Figure 5) than the GFS (Figure 6), which might allow the system(s) to consolidate better. This is a known bias of the GFS, and AI models do seem to handle 500-hPa flow and steering better than physics models on average, so that’s something to consider. We’ll see if that ridge trends stronger and if it’s enough to allow for consolidation into a TC.
The lack of support from the physics-based models makes me wonder if the AI models are being a little too aggressive, as they have been a few times in the Atlantic this year in the medium range. However, they have also sniffed out some of the recent activity in the West Pacific, and AIFS also had a better handle on the recent failed Invest 91L in the Atlantic. This will be an interesting one to come back to in about a week to see which model(s) verified better.