
How Good Were AI Models for Typhoon Ragasa?
One of the important things we do when looking at model forecasts of tropical cyclones is to go back after an event or season and see how the models performed, to give us a better idea of where they might need to be improved going forward. To get a full idea of performance, you really need a full season or preferably multiple seasons, to get a large sample size. But high-impact or tricky cases are also important to look at, as these case studies can show things that get washed out by a large average.
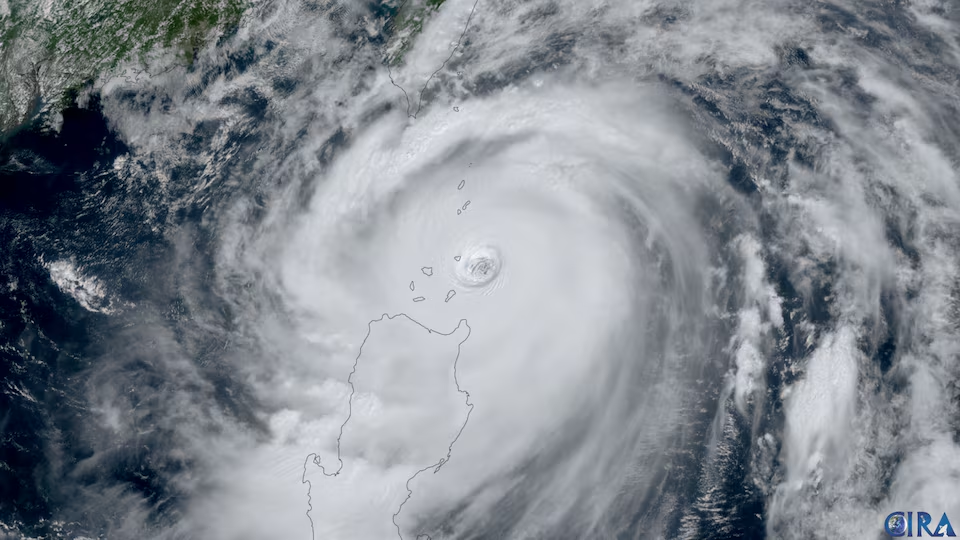
We are going to examine the recent Supertyphoon in the West Pacific, Ragasa, which impacted the Philippines and Babuyan Island before moving into Southeast China. The list of AI models that will be verified is as follows, along with the corresponding 4-letter “ATCF” (Automated Tropical Cyclone Forecast) code that is used in the files where we keep track of this data.
AIEN: AIFS Ensemble Control
AISN: AIFS Deterministic
PANG: Pangu Weather
AURO: Aurora
GRPC: GraphCast
FNV3: Google’s Deepmind
We will also compare these forecasts with two widely-used dynamical models, the Global Forecast System (GFS, listed as AVNO on the plots) and the Hurricane Analysis and Forecast System, version A (HFSA on the plots).
Verification is done by comparing the forecast track and intensity from each model at different lead times with the observed values. We used a verification software known as GROOT (https://github.com/NOAA-AOML/GROOT) developed by Sarah Ditchek, which has a wide variety of different ways to break down and examine the forecast verification. See this paper if you’re interested in learning more: https://doi.org/10.1175/WAF-D-22-0168.1.
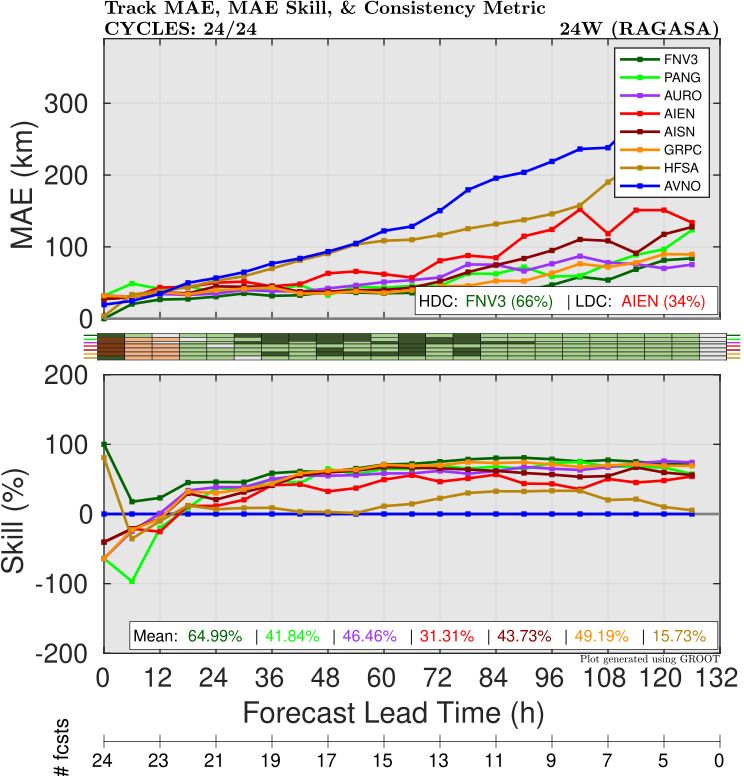
Track Verification
The track errors (Figure 1) show a lot of promise from the AI models. Google Deepmind (FNV3) was the best performer at most lead times, with GraphCast and Aurora a close second. All AI models outperformed both dynamical models (GFS and HAFS-A) at almost all lead times.
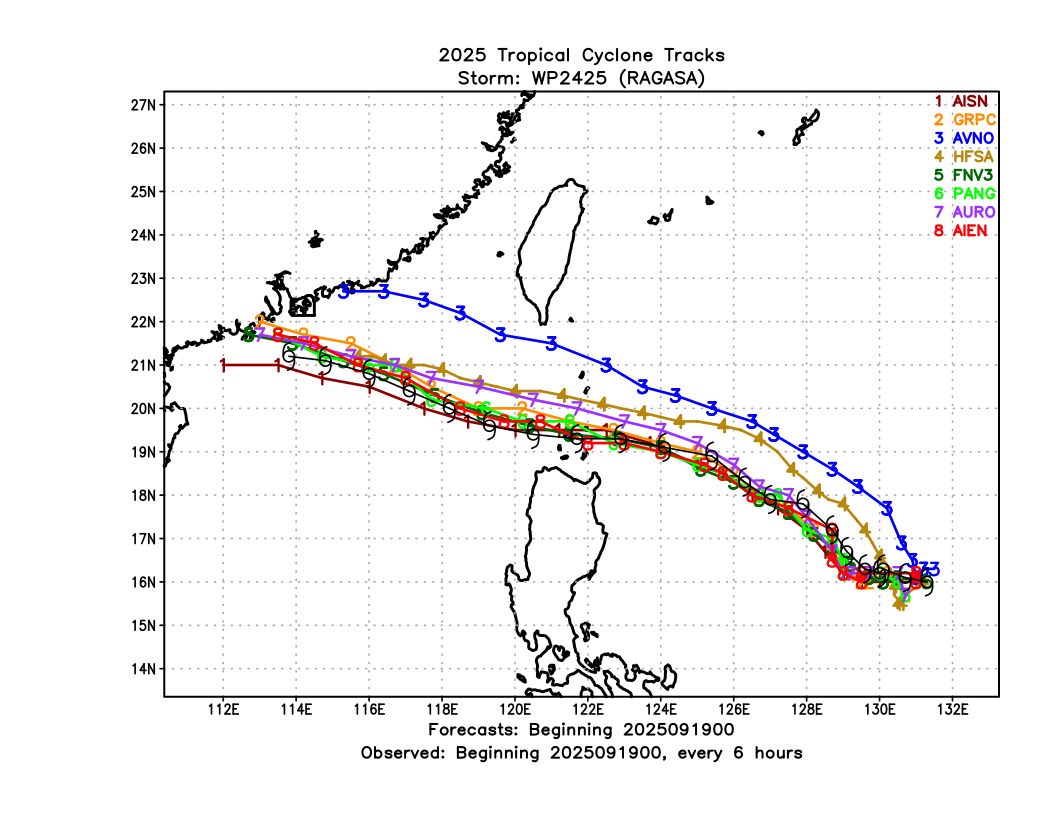
An example of some of these track forecasts is shown from September 19, 00 UTC (Figure 2). For this cycle, the GFS (AVNO) was too far north, showing Ragasa passing close to the southern tip of Taiwan. However, most of the AI-based models were far more accurate, correctly showing it passing between Luzon and Taiwan and near Babuyan Island.
Intensity Verification
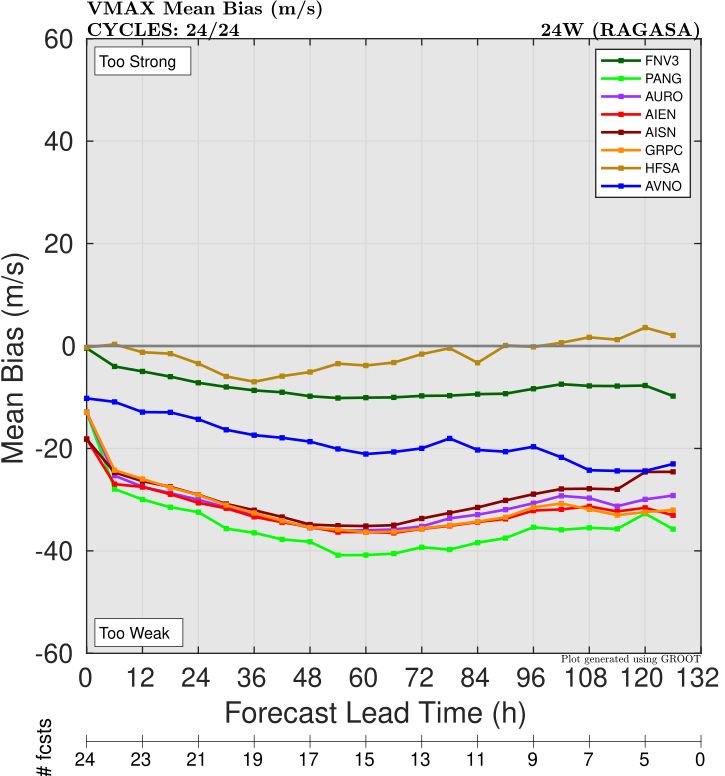
In most validations of AI models for TCs so far, the intensity performance has lagged significantly behind the track skill, largely due to the low resolution of the output. In general, that was the case for Ragasa for intensity error/skill (Figure 2), with models showing a weak/negative bias (Figure 3). The one notable exception was Google Deepmind (FNV3), which significantly outperformed the GFS at all lead times and was actually comparable to HAFS-A for the first 36 hours.
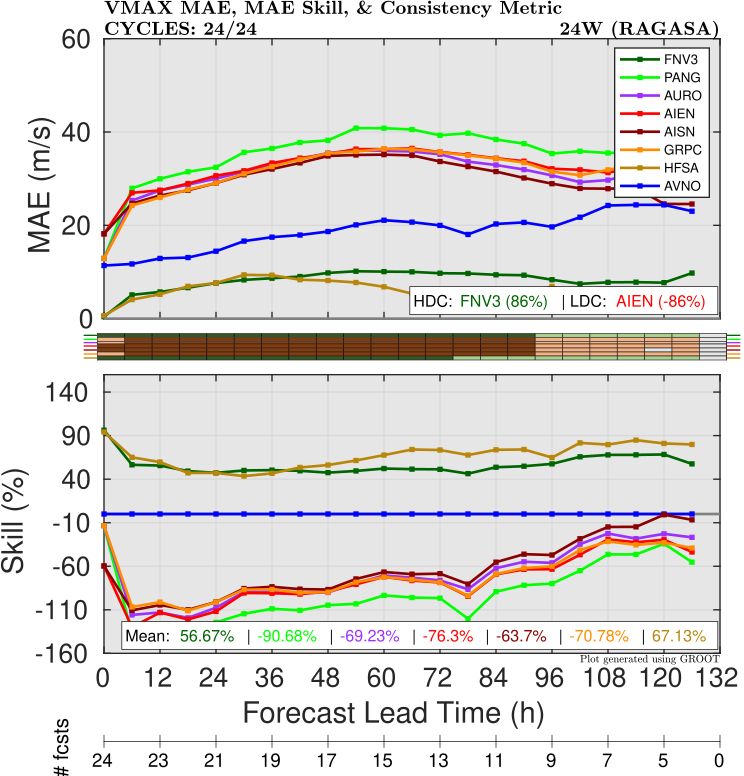
The negative bias of FNV3 was slightly worse than HAFS (Figure 4), but it is still impressive to see the progress that this configuration has made with some of the TC-specific bias correction.
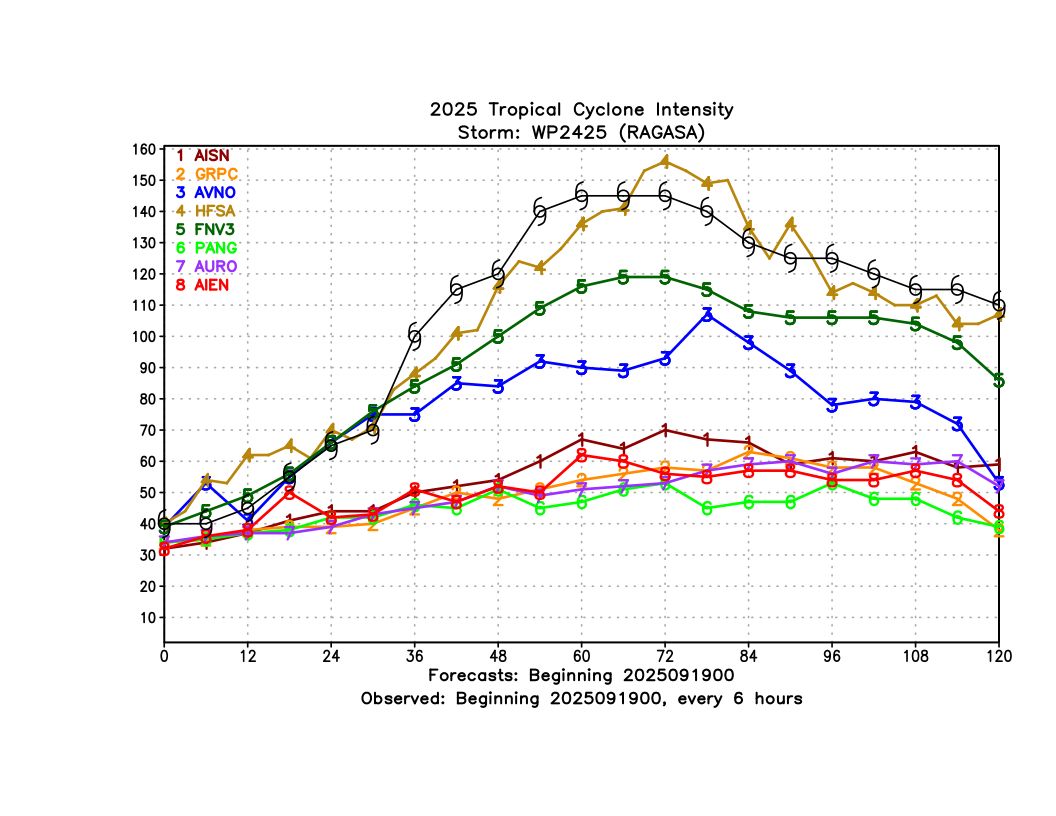
Looking at the same early forecast as shown previously (September 19, 00 UTC), we see that this intensity forecast evolution generally matched what we see in the averages, for both maximum wind speed (Figure 5) and minimum central pressure (Figure 6). HAFS-A, with its 2-km storm-following moving nest, was the only model to accurately depict the rapid intensification. However, FNV3 was not too far behind, with the ensemble mean showing Ragasa reaching a peak intensity of 120 knots.

Summary
For Typhoon Ragasa, AI models showed excellent track forecast performance, consistent with recent results from a variety of basins and models. In general, the intensity skill was lower than dynamical models, but FNV3 (Google’s Deepmind) demonstrated skill that was competitive with dynamical model forecasts, indicating that with continued development and progress, AI models can become a useful part of the TC intensity forecast process as well.